Alerting
Alerting resources require Grafana version 9.5 or higher.
The Grafana Operator currently only supports Grafana Managed Alerts.
For data source managed alerts, refer to the documentation and tooling available for the respective data source.
Note
When using Mimir/Prometheus, you can use themimir.rules.kubernetes component of Grafana Alloy to deploy rules as Kubernetes resources.Full example
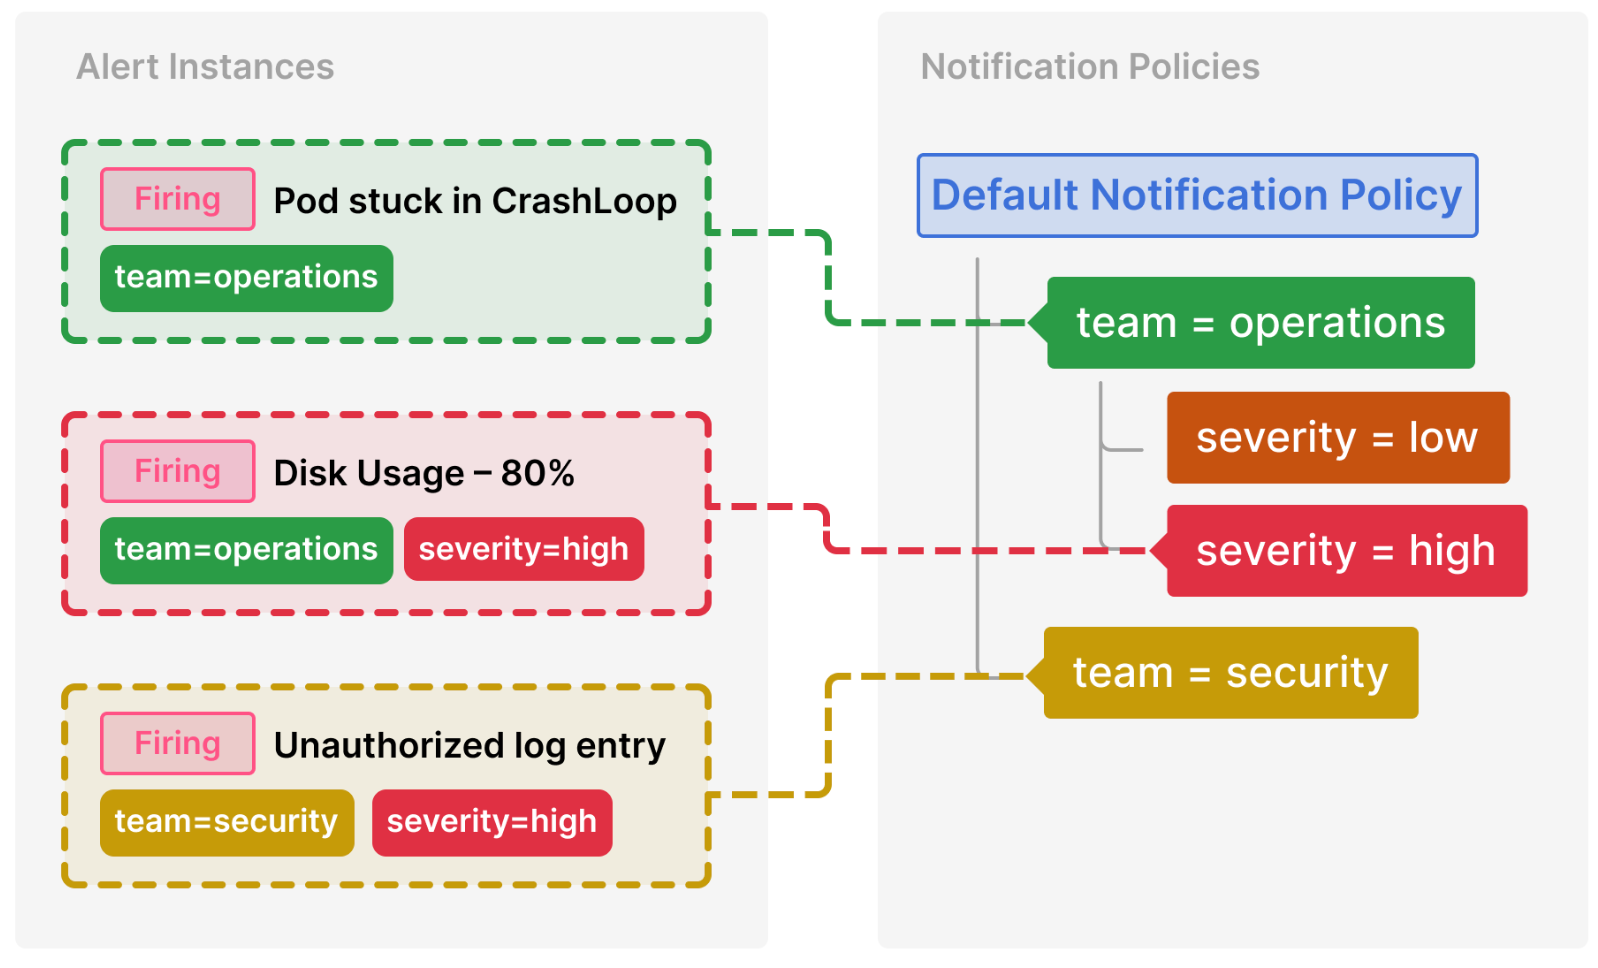
The following resources construct the flow outlined in the Grafana notification documentation.
They create:
- Three alert rules across two different groups
- Two contact points for two different teams
- A notification policy to route alerts to the correct team

Flowchart of alerts routed through this system
Note
If you want to try this for yourself, you can get started with demo data in Grafana cloud. The examples below utilize the data sources to give you real data to alert on.Alert rule groups
The first resources in this flow are Alert Rule Groups. An alert rule group can contain multiple alert rules. They group together alerts to run on the same interval and are stored in a Grafana folder, alongside dashboards.
First, create the folder:
apiVersion: grafana.integreatly.org/v1beta1
kind: GrafanaFolder
metadata:
  name: alerts-demo
spec:
  instanceSelector:
    matchLabels:
      instance: "my-grafana-stack"
The first alert rule group is responsible for alerting on well known Kubernetes issues:
---
apiVersion: grafana.integreatly.org/v1beta1
kind: GrafanaAlertRuleGroup
metadata:
  name: kubernetes-alert-rules
spec:
  folderRef: alerts-demo
  instanceSelector:
    matchLabels:
      instance: "my-grafana-stack"
  interval: 15m
  rules:
    - uid: be1q3344udslcf
      title: Pod stuck in CrashLoop
      condition: C
      for: 0s
      data:
        - refId: A
          relativeTimeRange:
            from: 600
            to: 0
          datasourceUid: grafanacloud-demoinfra-prom
          model:
            datasource:
                type: prometheus
                uid: grafanacloud-demoinfra-prom
            editorMode: code
            expr: max_over_time(kube_pod_container_status_waiting_reason{reason="CrashLoopBackOff", job!=""}[5m])
            instant: true
            intervalMs: 1000
            legendFormat: __auto
            maxDataPoints: 43200
            range: false
            refId: A
        - refId: B
          datasourceUid: __expr__
          model:
            conditions:
                - evaluator:
                    params: []
                    type: gt
                  operator:
                    type: and
                  query:
                    params:
                        - B
                  reducer:
                    params: []
                    type: last
                  type: query
            datasource:
                type: __expr__
                uid: __expr__
            expression: A
            intervalMs: 1000
            maxDataPoints: 43200
            reducer: last
            refId: B
            type: reduce
        - refId: C
          datasourceUid: __expr__
          model:
            conditions:
                - evaluator:
                    params:
                        - 0
                    type: gt
                  operator:
                    type: and
                  query:
                    params:
                        - C
                  reducer:
                    params: []
                    type: last
                  type: query
            datasource:
                type: __expr__
                uid: __expr__
            expression: B
            intervalMs: 1000
            maxDataPoints: 43200
            refId: C
            type: threshold
      noDataState: OK
      execErrState: Error
      labels:
        team: operations
      isPaused: false
    - uid: de1q3hd5d5clce
      for: 0s
      title: Disk Usage - 80%
      condition: C
      data:
        - refId: A
          relativeTimeRange:
            from: 600
            to: 0
          datasourceUid: grafanacloud-demoinfra-prom
          model:
            datasource:
                type: prometheus
                uid: grafanacloud-demoinfra-prom
            editorMode: code
            expr: node_filesystem_avail_bytes{mountpoint="/"} / node_filesystem_size_bytes{mountpoint="/"}
            instant: true
            intervalMs: 1000
            legendFormat: __auto
            maxDataPoints: 43200
            range: false
            refId: A
        - refId: B
          datasourceUid: __expr__
          model:
            conditions:
                - evaluator:
                    params: []
                    type: gt
                  operator:
                    type: and
                  query:
                    params:
                        - B
                  reducer:
                    params: []
                    type: last
                  type: query
            datasource:
                type: __expr__
                uid: __expr__
            expression: A
            intervalMs: 1000
            maxDataPoints: 43200
            reducer: last
            refId: B
            type: reduce
        - refId: C
          datasourceUid: __expr__
          model:
            conditions:
                - evaluator:
                    params:
                        - 0.2
                    type: lt
                  operator:
                    type: and
                  query:
                    params:
                        - C
                  reducer:
                    params: []
                    type: last
                  type: query
            datasource:
                type: __expr__
                uid: __expr__
            expression: B
            intervalMs: 1000
            maxDataPoints: 43200
            refId: C
            type: threshold
      noDataState: NoData
      execErrState: Error
      labels:
        severity: high
        team: operations
      isPaused: false
The second alert rule group is responsible for alerting on security issues:
---
apiVersion: grafana.integreatly.org/v1beta1
kind: GrafanaAlertRuleGroup
metadata:
  name: security-alert-rules
spec:
  folderRef: alerts-demo
  instanceSelector:
    matchLabels:
      instance: "my-grafana-stack"
  interval: 5m
  rules:
    - uid: fe1q7kelzb400a
      title: Unauthorized log entry
      condition: C
      for: 0s
      data:
        - refId: A
          queryType: range
          relativeTimeRange:
            from: 600
            to: 0
          datasourceUid: grafanacloud-demoinfra-logs
          model:
            datasource:
                type: loki
                uid: grafanacloud-demoinfra-logs
            editorMode: code
            expr: count_over_time({namespace="quickpizza",container="copy"}[5m] |= "unauthorized")
            hide: false
            intervalMs: 1000
            maxDataPoints: 43200
            queryType: range
            refId: A
        - refId: B
          datasourceUid: __expr__
          model:
            conditions:
                - evaluator:
                    params: []
                    type: gt
                  operator:
                    type: and
                  query:
                    params:
                        - B
                  reducer:
                    params: []
                    type: last
                  type: query
            datasource:
                type: __expr__
                uid: __expr__
            expression: A
            intervalMs: 1000
            maxDataPoints: 43200
            reducer: last
            refId: B
            type: reduce
        - refId: C
          datasourceUid: __expr__
          model:
            conditions:
                - evaluator:
                    params:
                        - 0
                    type: gt
                  operator:
                    type: and
                  query:
                    params:
                        - C
                  reducer:
                    params: []
                    type: last
                  type: query
            datasource:
                type: __expr__
                uid: __expr__
            expression: B
            intervalMs: 1000
            maxDataPoints: 43200
            refId: C
            type: threshold
      noDataState: OK
      execErrState: Error
      labels:
        team: security
        severity: high
      isPaused: false
After applying the resources, you can see the created rule groups in the Alert rules overview page:

Contact Points
Before you can route alerts to the correct receivers, you need to define how these alerts should be delivered. Contact points specify the methods used to notify someone using different providers.
Since the two different teams get notified using different email addresses, two contact points are required.
---
apiVersion: grafana.integreatly.org/v1beta1
kind: GrafanaContactPoint
metadata:
  name: operations-team
spec:
  name: operations-team
  type: "email"
  instanceSelector:
    matchLabels:
      instance: my-grafana-stack
  settings:
    addresses: 'operations@example.com'
---
apiVersion: grafana.integreatly.org/v1beta1
kind: GrafanaContactPoint
metadata:
  name: security-team
spec:
  name: security-team
  type: "email"
  instanceSelector:
    matchLabels:
      instance: my-grafana-stack
  settings:
    addresses: 'security@example.com'
Notification Policy
Now that all parts are in place, the only missing component is the notification policy. The instances notification policy routes alerts to contact points based on labels. A Grafana instance can only have one notification policy applied at a time as it’s a global object.
The following notification policy routes alerts based on the team label and further configures the repetition interval for high severity alerts belonging to the operations team:
---
apiVersion: grafana.integreatly.org/v1beta1
kind: GrafanaNotificationPolicy
metadata:
  name: test
spec:
  instanceSelector:
    matchLabels:
      instance: "my-grafana-stack"
  route:
    receiver: grafana-default-email
    group_by:
      - grafana_folder
      - alertname
    routes:
      - receiver: operations-team
        object_matchers:
          - - team
            - =
            - operations
        routes:
          - object_matchers:
              - - severity
                - =
                - high
            repeat_interval: 5m
      - receiver: security-team
        object_matchers:
          - - team
            - =
            - security
After applying the resource, Grafana shows the following notification policy tree:
