0.1 Take a tour of Grafana
Never used Grafana before? Start here.
This short lab is optional, but recommended if Grafana is new to you. By the end, you'll know how to find your way around the interface, and recognize the few features we'll lean on throughout the rest of the workshop. It should take about 10 minutes.
If you're already comfortable with Grafana, feel free to skim this lab. Scroll to the bottom of this page to head straight to Lab 1.
Step 1: Find your way around the navigation menu
Almost everything in Grafana is reached from the navigation menu on the left-hand side.
- Click the menu icon (the three horizontal lines, sometimes called the "hamburger" icon) in the top-left corner to open the menu.
- Click the close button to close it again, giving your dashboards more room.
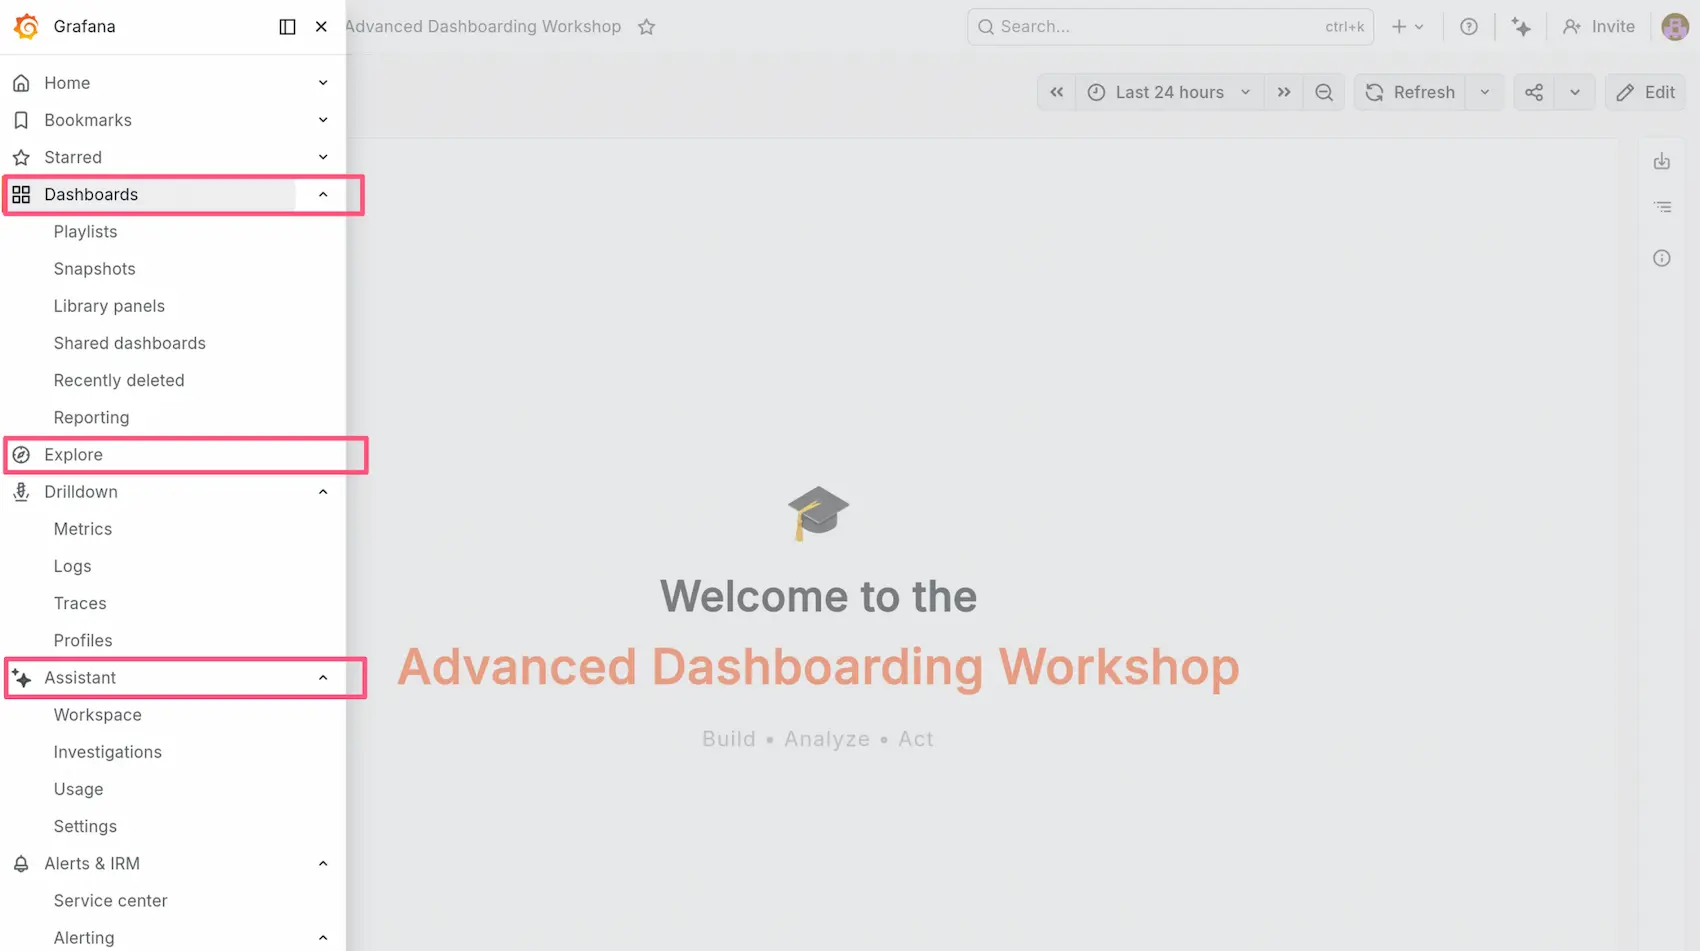
Here are the areas in the sidebar that you'll use most in this workshop:
| Menu item | What it's for |
|---|---|
| Dashboards | Where your dashboards live. You'll create, organize, and open dashboards from here. |
| Explore | Run ad-hoc queries against a data source without building a dashboard first. Great for poking at data. |
| Assistant | Grafana's built-in AI helper. Powerful, and an excellent dashboard design buddy! We'll use this a lot today, to build panels quickly. |
| Connections → Data sources | The databases and APIs that Grafana reads from (Prometheus, Loki, MySQL, and more). |

You don't need to learn every menu item. The table above covers everything we use in the workshop. If you ever get lost, the menu icon in the top-left will always bring you home.
Step 2: Understand dashboards and panels
A dashboard is a single screen made up of one or more panels. Each panel runs a query against a data source and visualizes the result — as a graph, a stat, a table, a log stream, and so on.
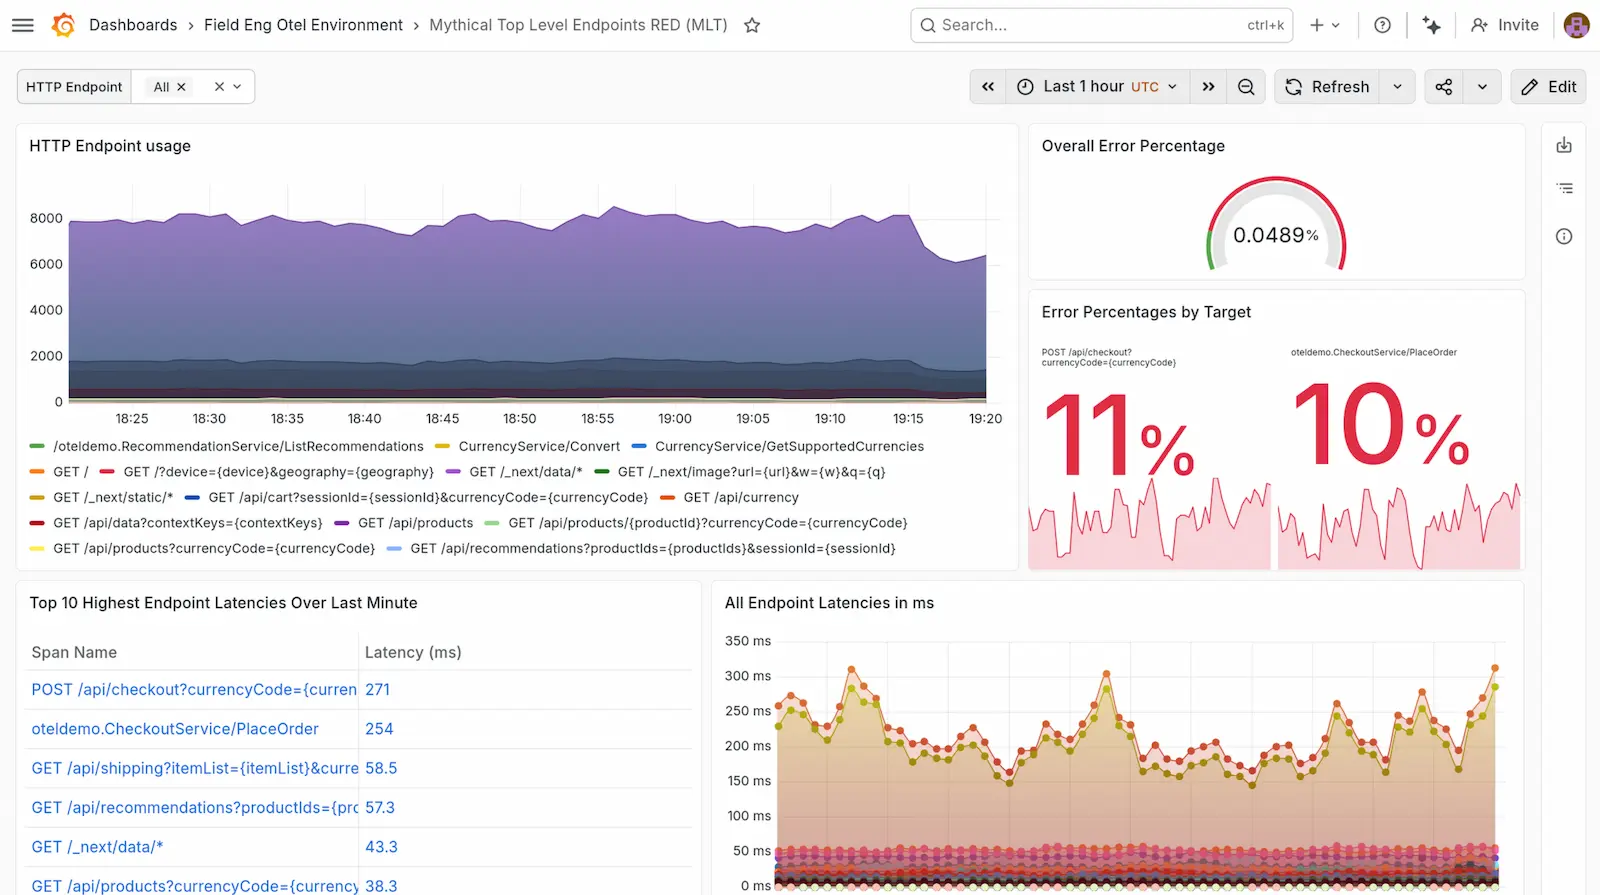
Open any existing dashboard (Dashboards in the menu, then click one) and try the following:
- Hover over a panel. A small context menu (three dots) appears in the top-right of the panel.
- From the context menu, choose Edit to see how it's built — if the panel has a query, you will see it at the bottom, and the visualization options are presented on the right. (Don't save any changes for now.)
- Click Back to dashboard (top-left) and Exit edit to return without saving.
Panels are the building blocks of everything you'll create today.
Step 3: Change the time range
Most Grafana data is time-based, so almost every dashboard has a time picker in the top-right corner.
- Click the time picker (it usually shows something like Last 6 hours).
- Choose a different quick range, such as Last 24 hours, or set a custom absolute range.
- Use the refresh icon next to it to reload the data, or set it to refresh automatically.
If a panel shows "No data", the first thing to check is the time range, because you might simply be looking at a window where no data exists. When you widen the time range, the data will often reappear.
Step 4: Search, and make yourself at home

A couple of finishing touches:
- Search: Use the search icon (magnifying glass) at the top of the page to jump straight to any dashboard by name — quicker than browsing folders.
- Assistant: You can access Assistant any time using the assistant icon (the stars).
- Light or dark mode: To toggle the theme in Grafana quickly between light and dark modes, press the letter c then the letter t on your keyboard. Magic! (You can also toggle the theme of this workshop site using the icon in its top-right corner.)
You're ready
That's the whole tour. You now know how to:
- Open the navigation menu and find Dashboards, Explore, Connections, and the Assistant
- Open a dashboard, inspect a panel, and read its query
- Change the time range and refresh data
- Search for dashboards and set your preferred theme
That's all the orientation you need. When you're ready, click Next to start Lab 1, where you'll build your first dashboard from scratch.