2.1. Write metric queries
Calculate a metric from log lines
In Loki, you can easily calculate metrics based on the number of log lines that have certain properties -- for example, the rate of error logs. This is called log range aggregation.
In this section of the workshop we will analyze log volume, using Loki's query-time JSON parsing, and LogQL metric functions count_over_time and sum.
-
From the Grafana main menu, choose Explore and then from the data source picker, select the LokiNGINX datasource.
-
Click on the Code button to show the LogQL code editor. Paste the following query into the query box then press Run query:
{filename="/var/log/nginx/json_access.log"} |= "Googlebot"Notice that you get JSON log lines of googlebot requests. Click a log line to see its details.
-
At this point, Loki hasn't yet parsed the JSON. It shows the log line in plain text. To parse the log line, we need to add a parser, like
json.Change the query to the following and then press Run query:
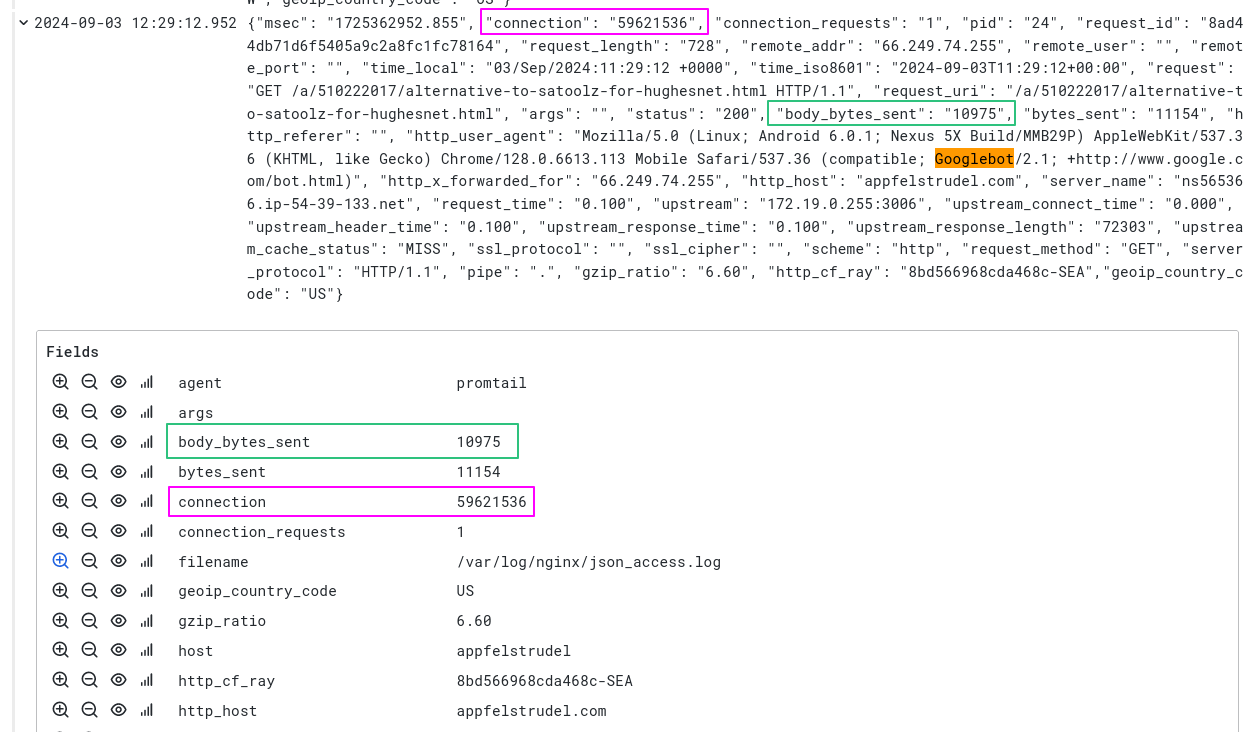
{filename="/var/log/nginx/json_access.log"} |= "Googlebot" | jsonNow click a log line to expand it.
Notice how the fields from the JSON message have been parsed by Loki and are now shown in the Fields panel. We can now use these fields in a metric query.
This screenshot highlights just a couple of the fields that have been extracted:
-
Edit the query to this and then run it:
sum by(status) (count_over_time({filename="/var/log/nginx/json_access.log"} |= `Googlebot` | json [5m]))Now Grafana will show the amount of Googlebot requests per minute, split by (HTTP) status code.
tipTo understand a Loki LogQL query, click on the Explain query toggle.
-
Click the + Add query button and paste in the following query, which calculates the total number of log entries over time in our NGINX log:
sum by (request_method) (count_over_time({filename="/var/log/nginx/json_access.log"} | json [5m]))Grafana shows the results of the two queries together, in the same graph. This graph allows us to see:
- The total number of requests over time
- The number of requests which came from Googlebot, broken down by HTTP status code
- The proportion of Googlebot requests, compared to all requests
This information was extracted by Loki in real time, without having to parse logs upfront.
Calculate a metric based on a value in the log
In Loki, you can also calculate metrics using values inside the log line itself -- for example, graphing the average response time, or the average payload size over time. This is called an unwrapped range aggregation. It uses the unwrap function to pass a field from the log line to a metric function, such as avg_over_time or max_over_time.
-
Run the following query to extract the
bytes_sentfield from every JSON log line. This will draw a chart of how many avg bytes are requested by GoogleBot for every 5 minutes:avg_over_time({filename="/var/log/nginx/json_access.log"} |= "Googlebot" | json | unwrap bytes_sent [5m]) by (host) -
Click the + Add query button to add another query:
max_over_time({filename="/var/log/nginx/json_access.log"} |= "Googlebot" | json | unwrap bytes_sent [5m]) by (host)infomax_over_timecalculates the maximum of all values in the specified interval (in this example, 5 minutes).Notice that a second metric series is added to the graph, where we return the max amount of response bytes within that
5minterval.
The completed graph from this exercise shows us the average bytes sent by NGINX over time, as compared with the largest payload sent, over the same time period.