3.2. Investigate a fully instrumented system with Grafana Assistant
In this lab, you'll investigate a fully instrumented microservices application in Grafana Cloud with Grafana Assistant. Grafana Assistant is a purpose-built LLM assistant that can help you understand your Grafana environment, troubleshoot incidents, and make recommendations.
In this lab we've deployed the OpenTelemetry Demo — a production-grade system where services are exporting OpenTelemetry traces, metrics and logs.
Your goal in this mission is to use Grafana Assistant to understand the system, identify patterns, and gain useful insights.
Step 1: Get ready
Log on to the environment to get started:
-
Go to the Reference Grafana URL that you have been given (Hint: the URL looks like
https://abcd12appenv.grafana.net). -
If you are presented with a choice of sign-in options, click Sign in with SSO.
-
At the Authentication login screen, enter the username (not email) and password that you received by email, or from your instructor.
Step 2: How to access Grafana Assistant
In this step, you'll see the many ways you can access Grafana Assistant from within Grafana.
Top bar
Grafana Assistant can be opened from the always-present top bar of Grafana.
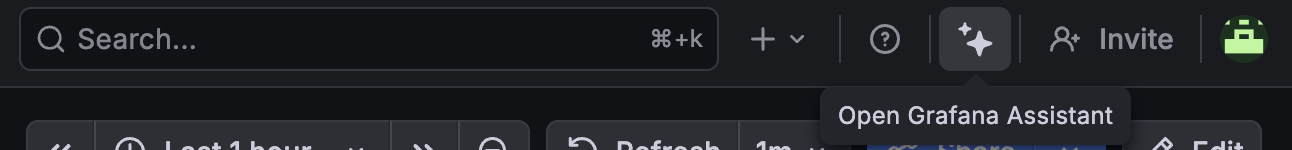
This opens a side drawer within Grafana, and you can always interact with it this way.
Main Menu
Within Grafana's Main Menu, you can see an item called Assistant. Clicking that takes you to the Assistant App.
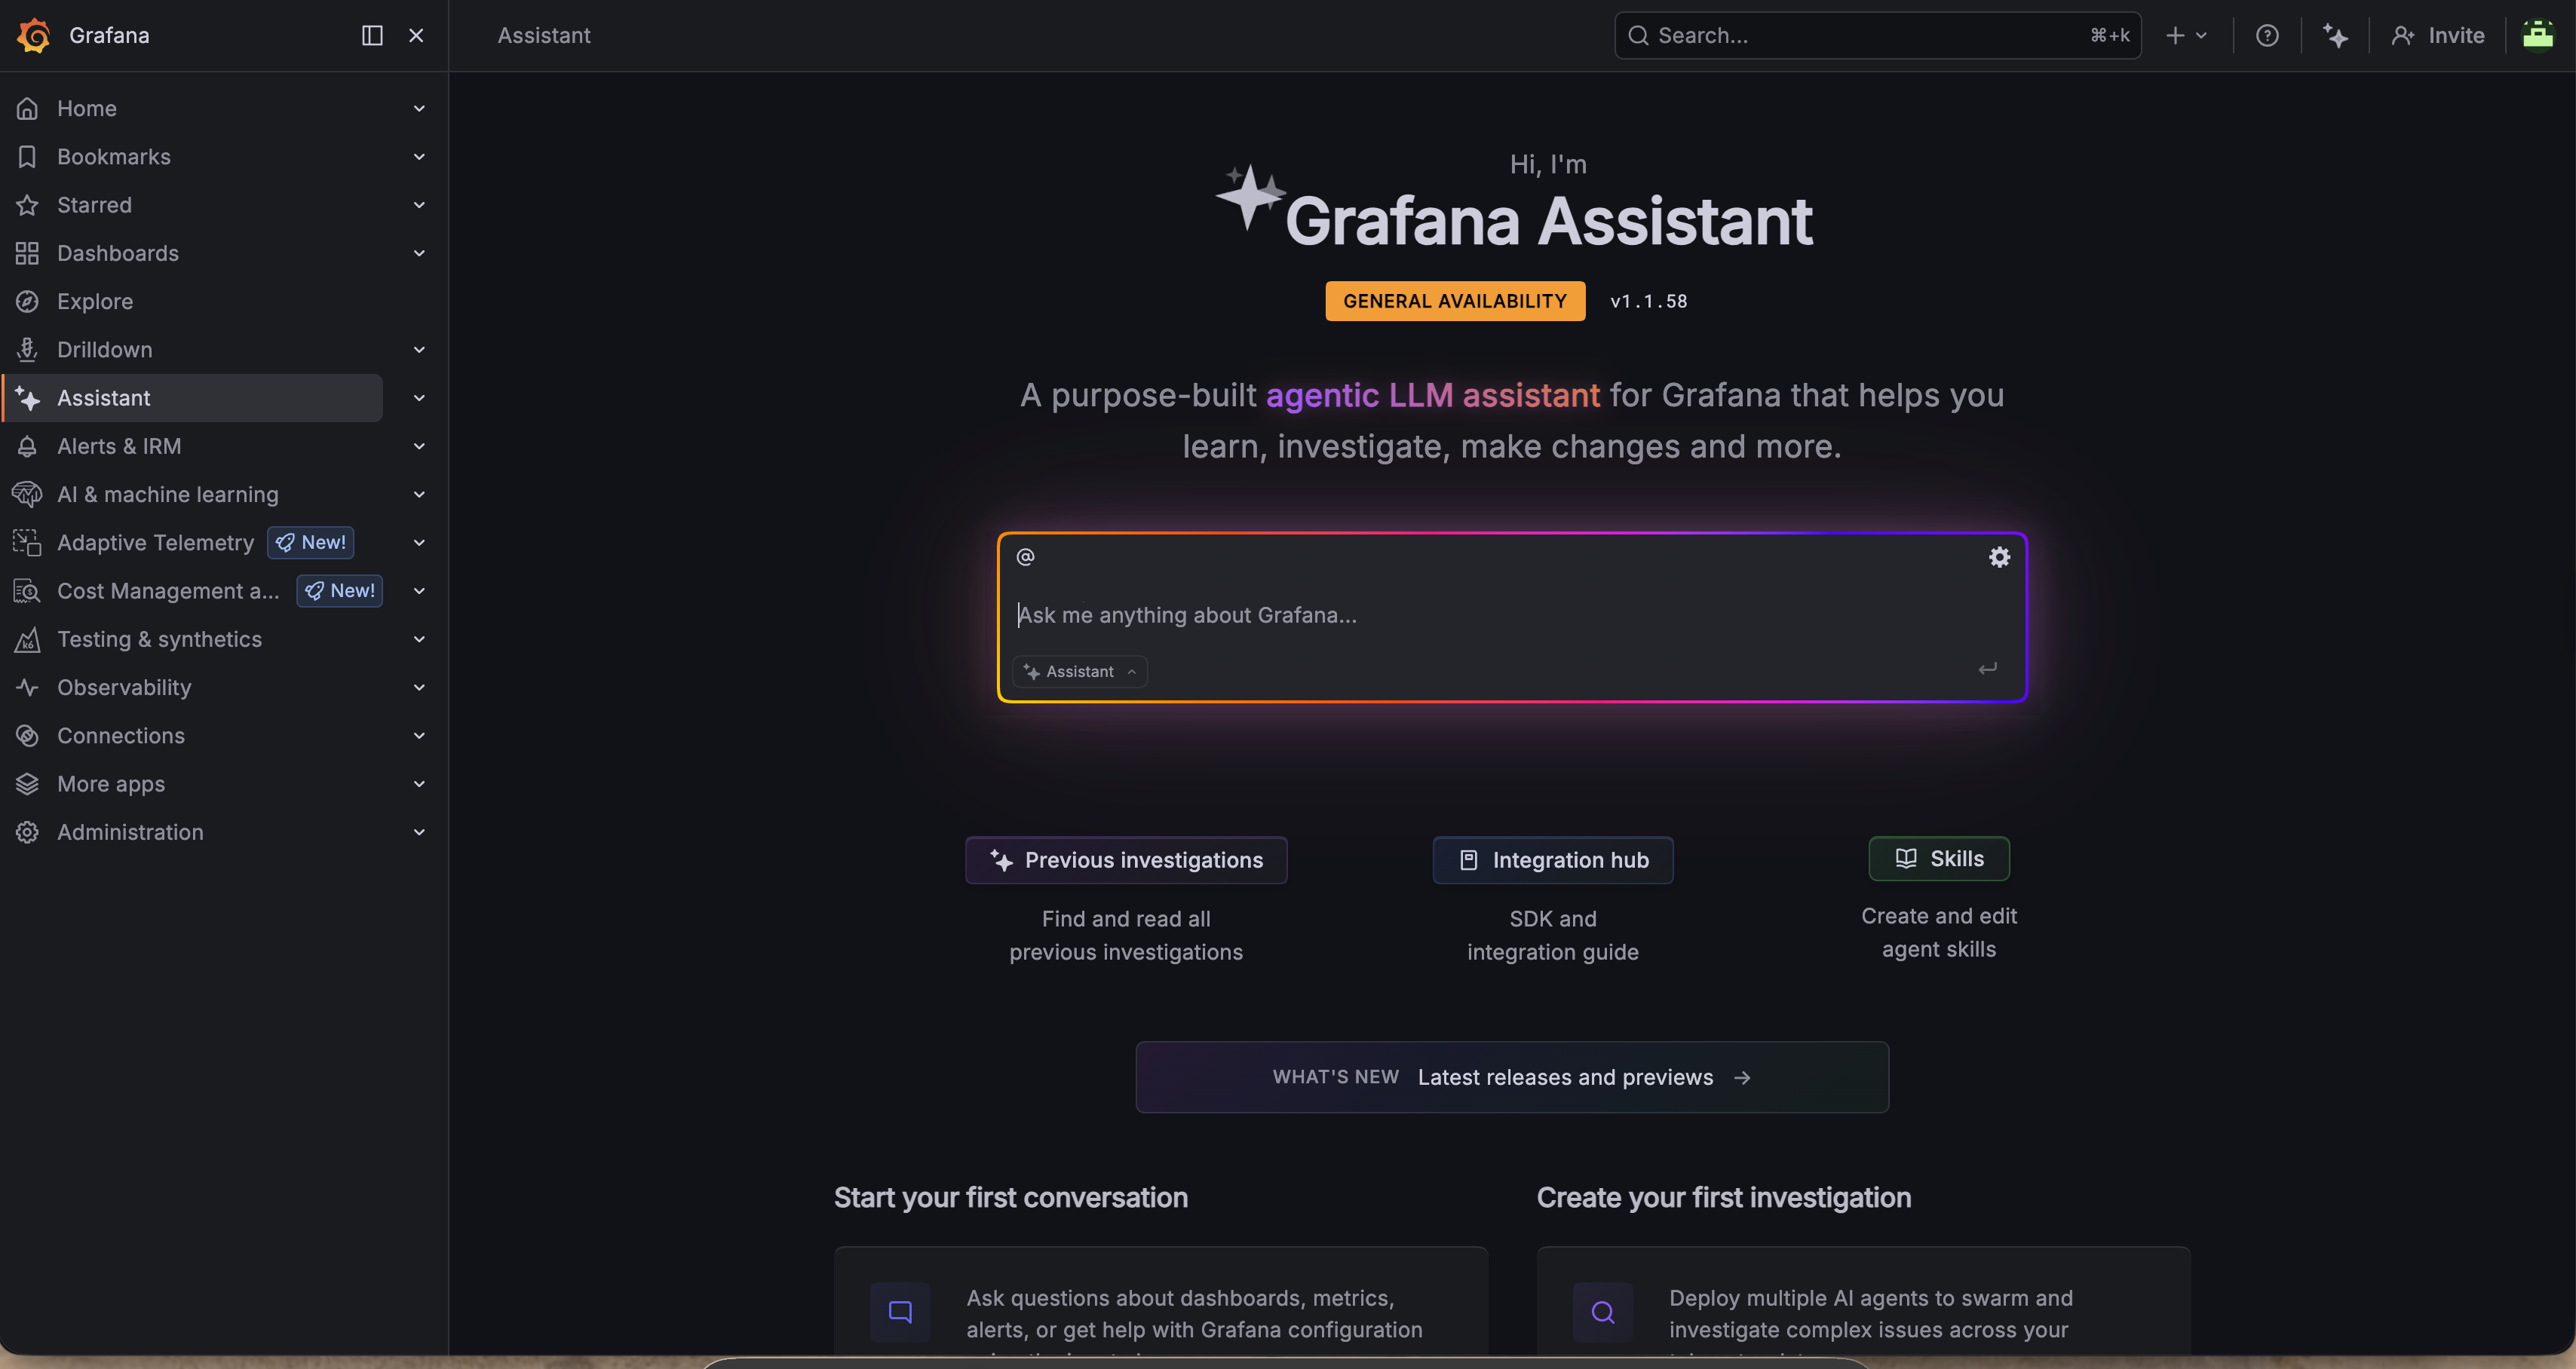
From here, you can use it like a search bar and interact with Assistant.
Everywhere else
Grafana Assistant is available throughout all of Grafana. Whenever you see the two stars, like in the top bar, you can click them and Assistant will be there to help you.
Step 3: Using Assistant
Grafana Assistant knows everything about Grafana and its surrounding ecosystem. This ranges from instrumentation, exploration, investigation, root cause analysis and general usage of Grafana.
You can ask it to create alerts, dashboards and queries. You can ask it to share best practices so you can learn and enhance your skill set. You can ask it to connect to external systems via MCP, and much more. You can even bring your own context through Skills, rules, memories and more — although these are out of scope for this workshop.
Due to the variable nature of an LLM assistant, the results will not always look the same between users or match what we found in previous exercises. If Assistant doesn't do what you want it to do, prompt it some more to nudge it in the right direction.
How many services are running?
Open Assistant and ask it:
How many services are running? For each service, tell me its name, version, cloud provider, region and k8s node it's running in.
This shows how Assistant thinks through the request — "thinking" is always shown. You can then see how it queries Grafana itself. It might query metrics, knowledge graph, logs, traces, profiles and more.
Let's break something
To make for a more interesting scenario, let's break a few things.
-
Go to the Field Eng Otel Environment dashboard folder and open the Feature Flags dashboard.
-
In our demo environment, we've added many failure scenarios so things break in wonderful ways.
Turn on the
productCatalogReadFromPostgresandproductCatalogStopClosingPostgresConnectionsfeature flags by pressing theenablebutton. -
Give it a few minutes to start degrading...
In the meantime, let's understand the instrumentation health of our services.
Explore semantic correctness
Ask Assistant something like:
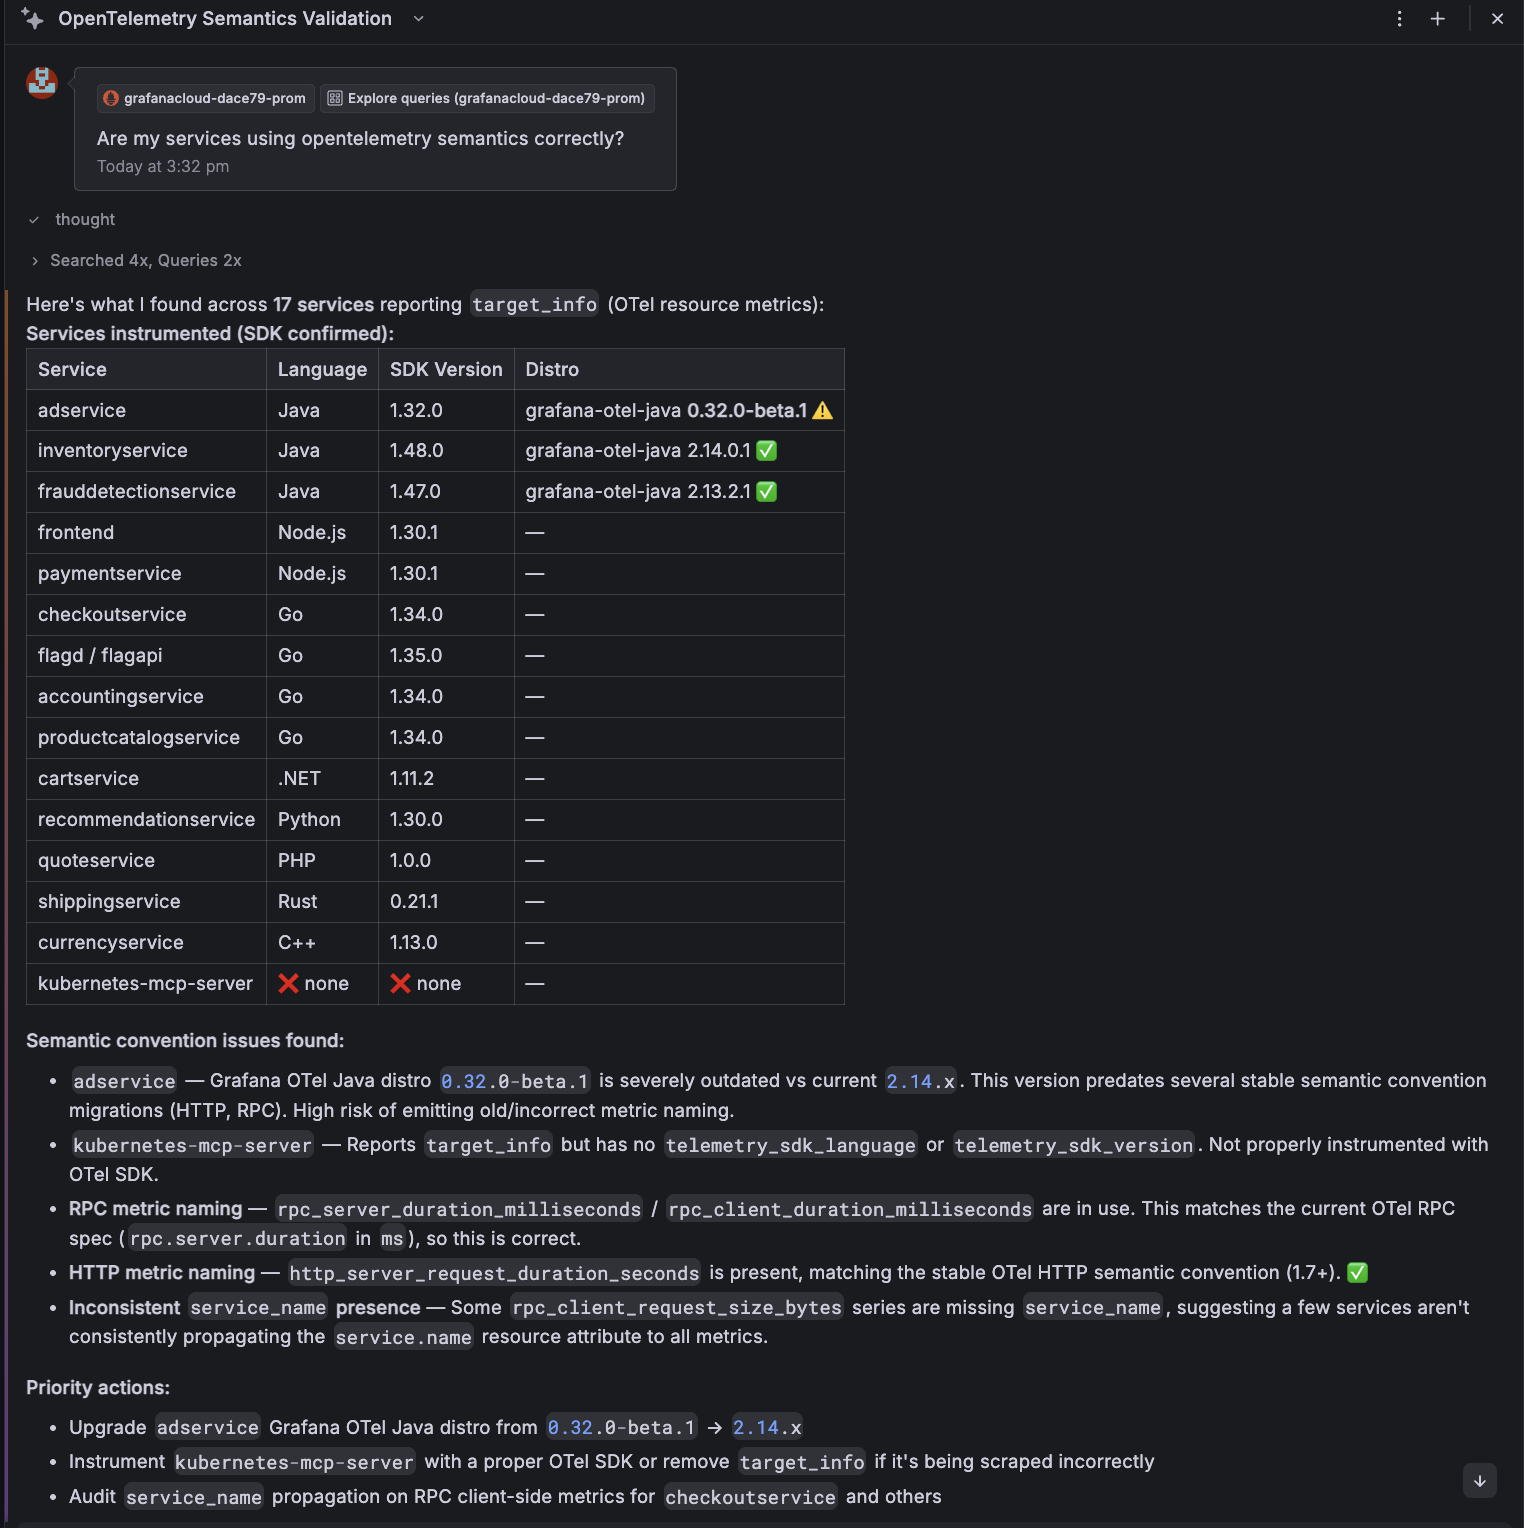
Are my services using OpenTelemetry semantics correctly?
Assistant will analyse the data and understand what attributes are being used. You can see here that it advises us that the application is using the old semantic convention. It outlines what's correct and the attribute that should have been used instead:
Are they healthy?
Now things should be nice and broken...
Ask Assistant:
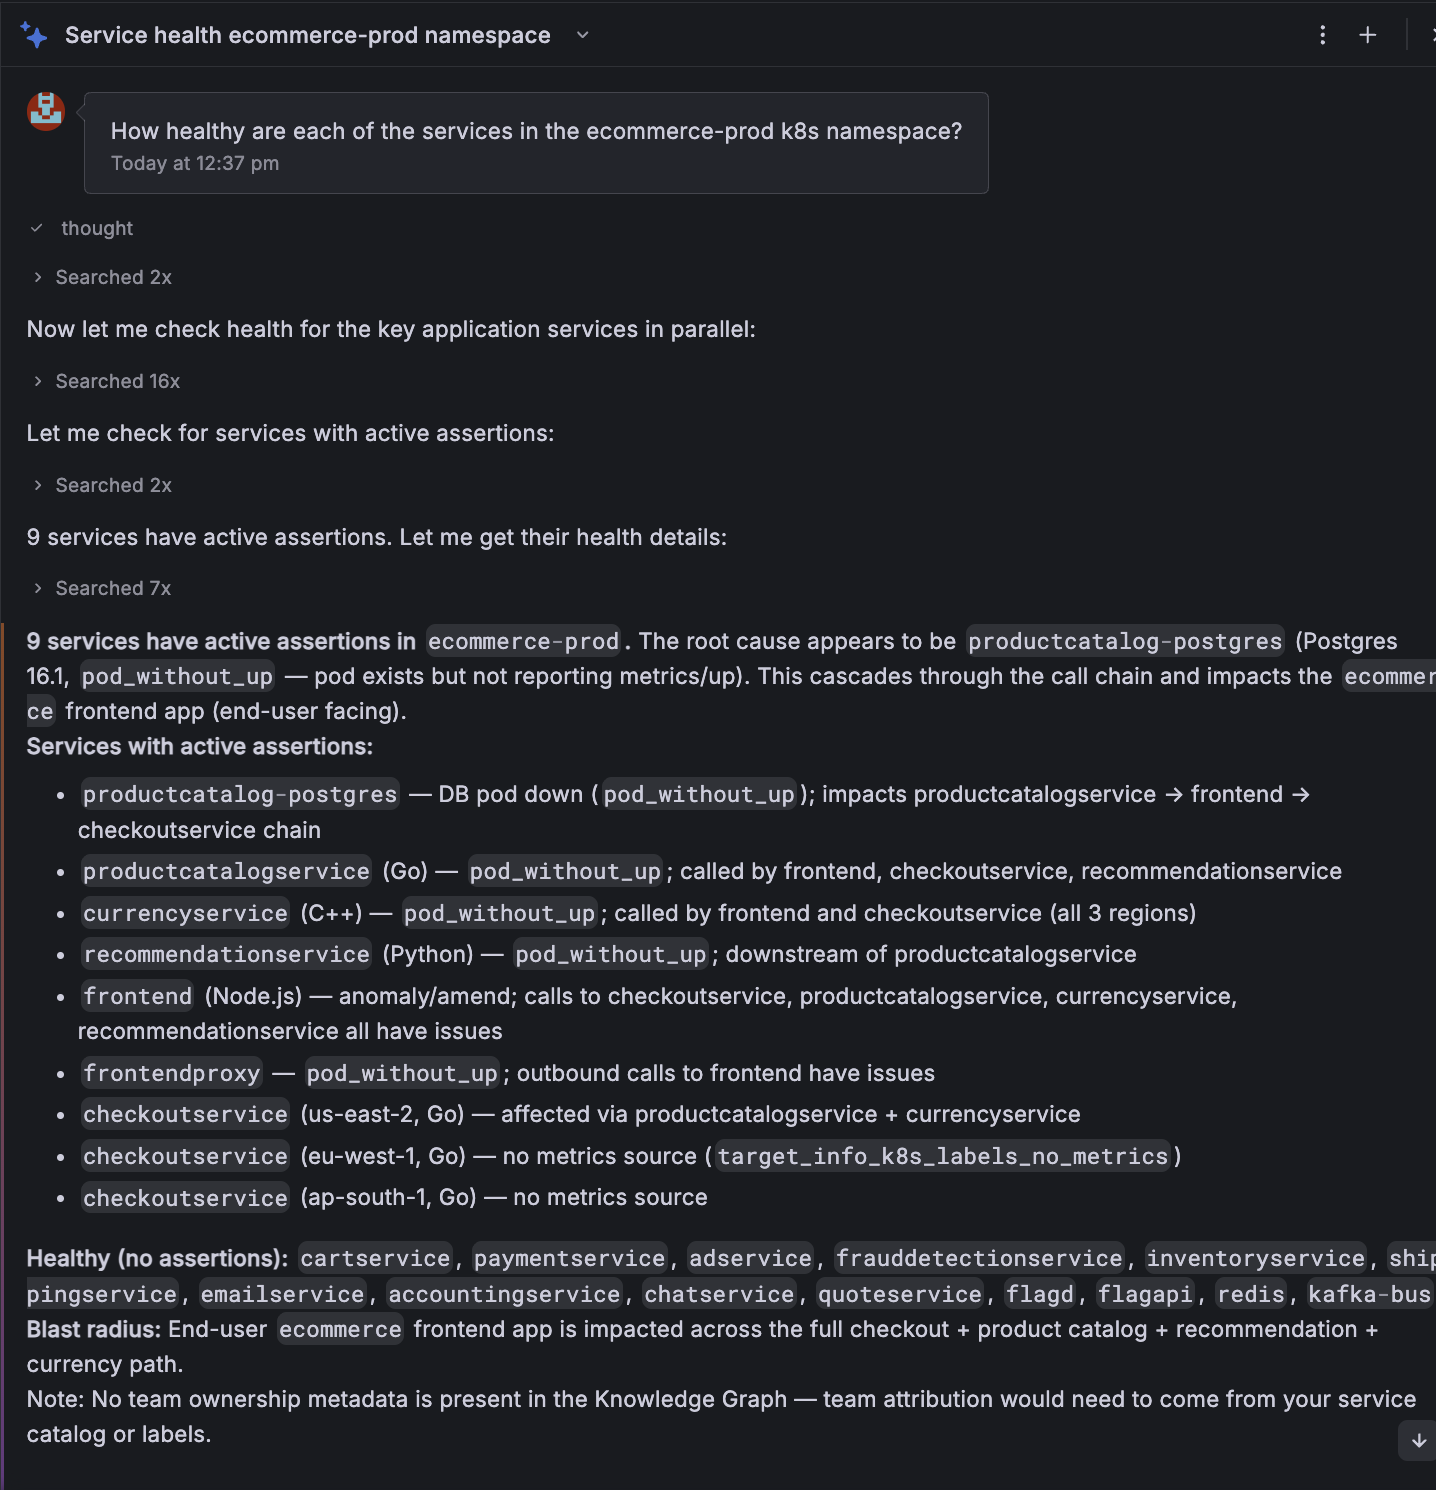
How healthy are the services in the
ecommerce-prodk8s namespace?
This is a more in-depth question, and Assistant will likely spin up multiple agents to do this asynchronously. As before, it will look for all the services in Knowledge Graph, look to understand what data sources are available and then query metrics, logs and traces to determine the health.
For each tool call, you can inspect the parameters and queries, as well as the thinking for each step of the investigation.
As part of Assistant's response to your question, it will likely check to see if any alerts are firing and the state of SLOs also.
The result looks something like this:
From here, you can ask follow-up questions — you could ask it to create alerts based on conditions and much more. Or, you could ask it to create a dashboard to summarise these issues.
Finish troubleshooting
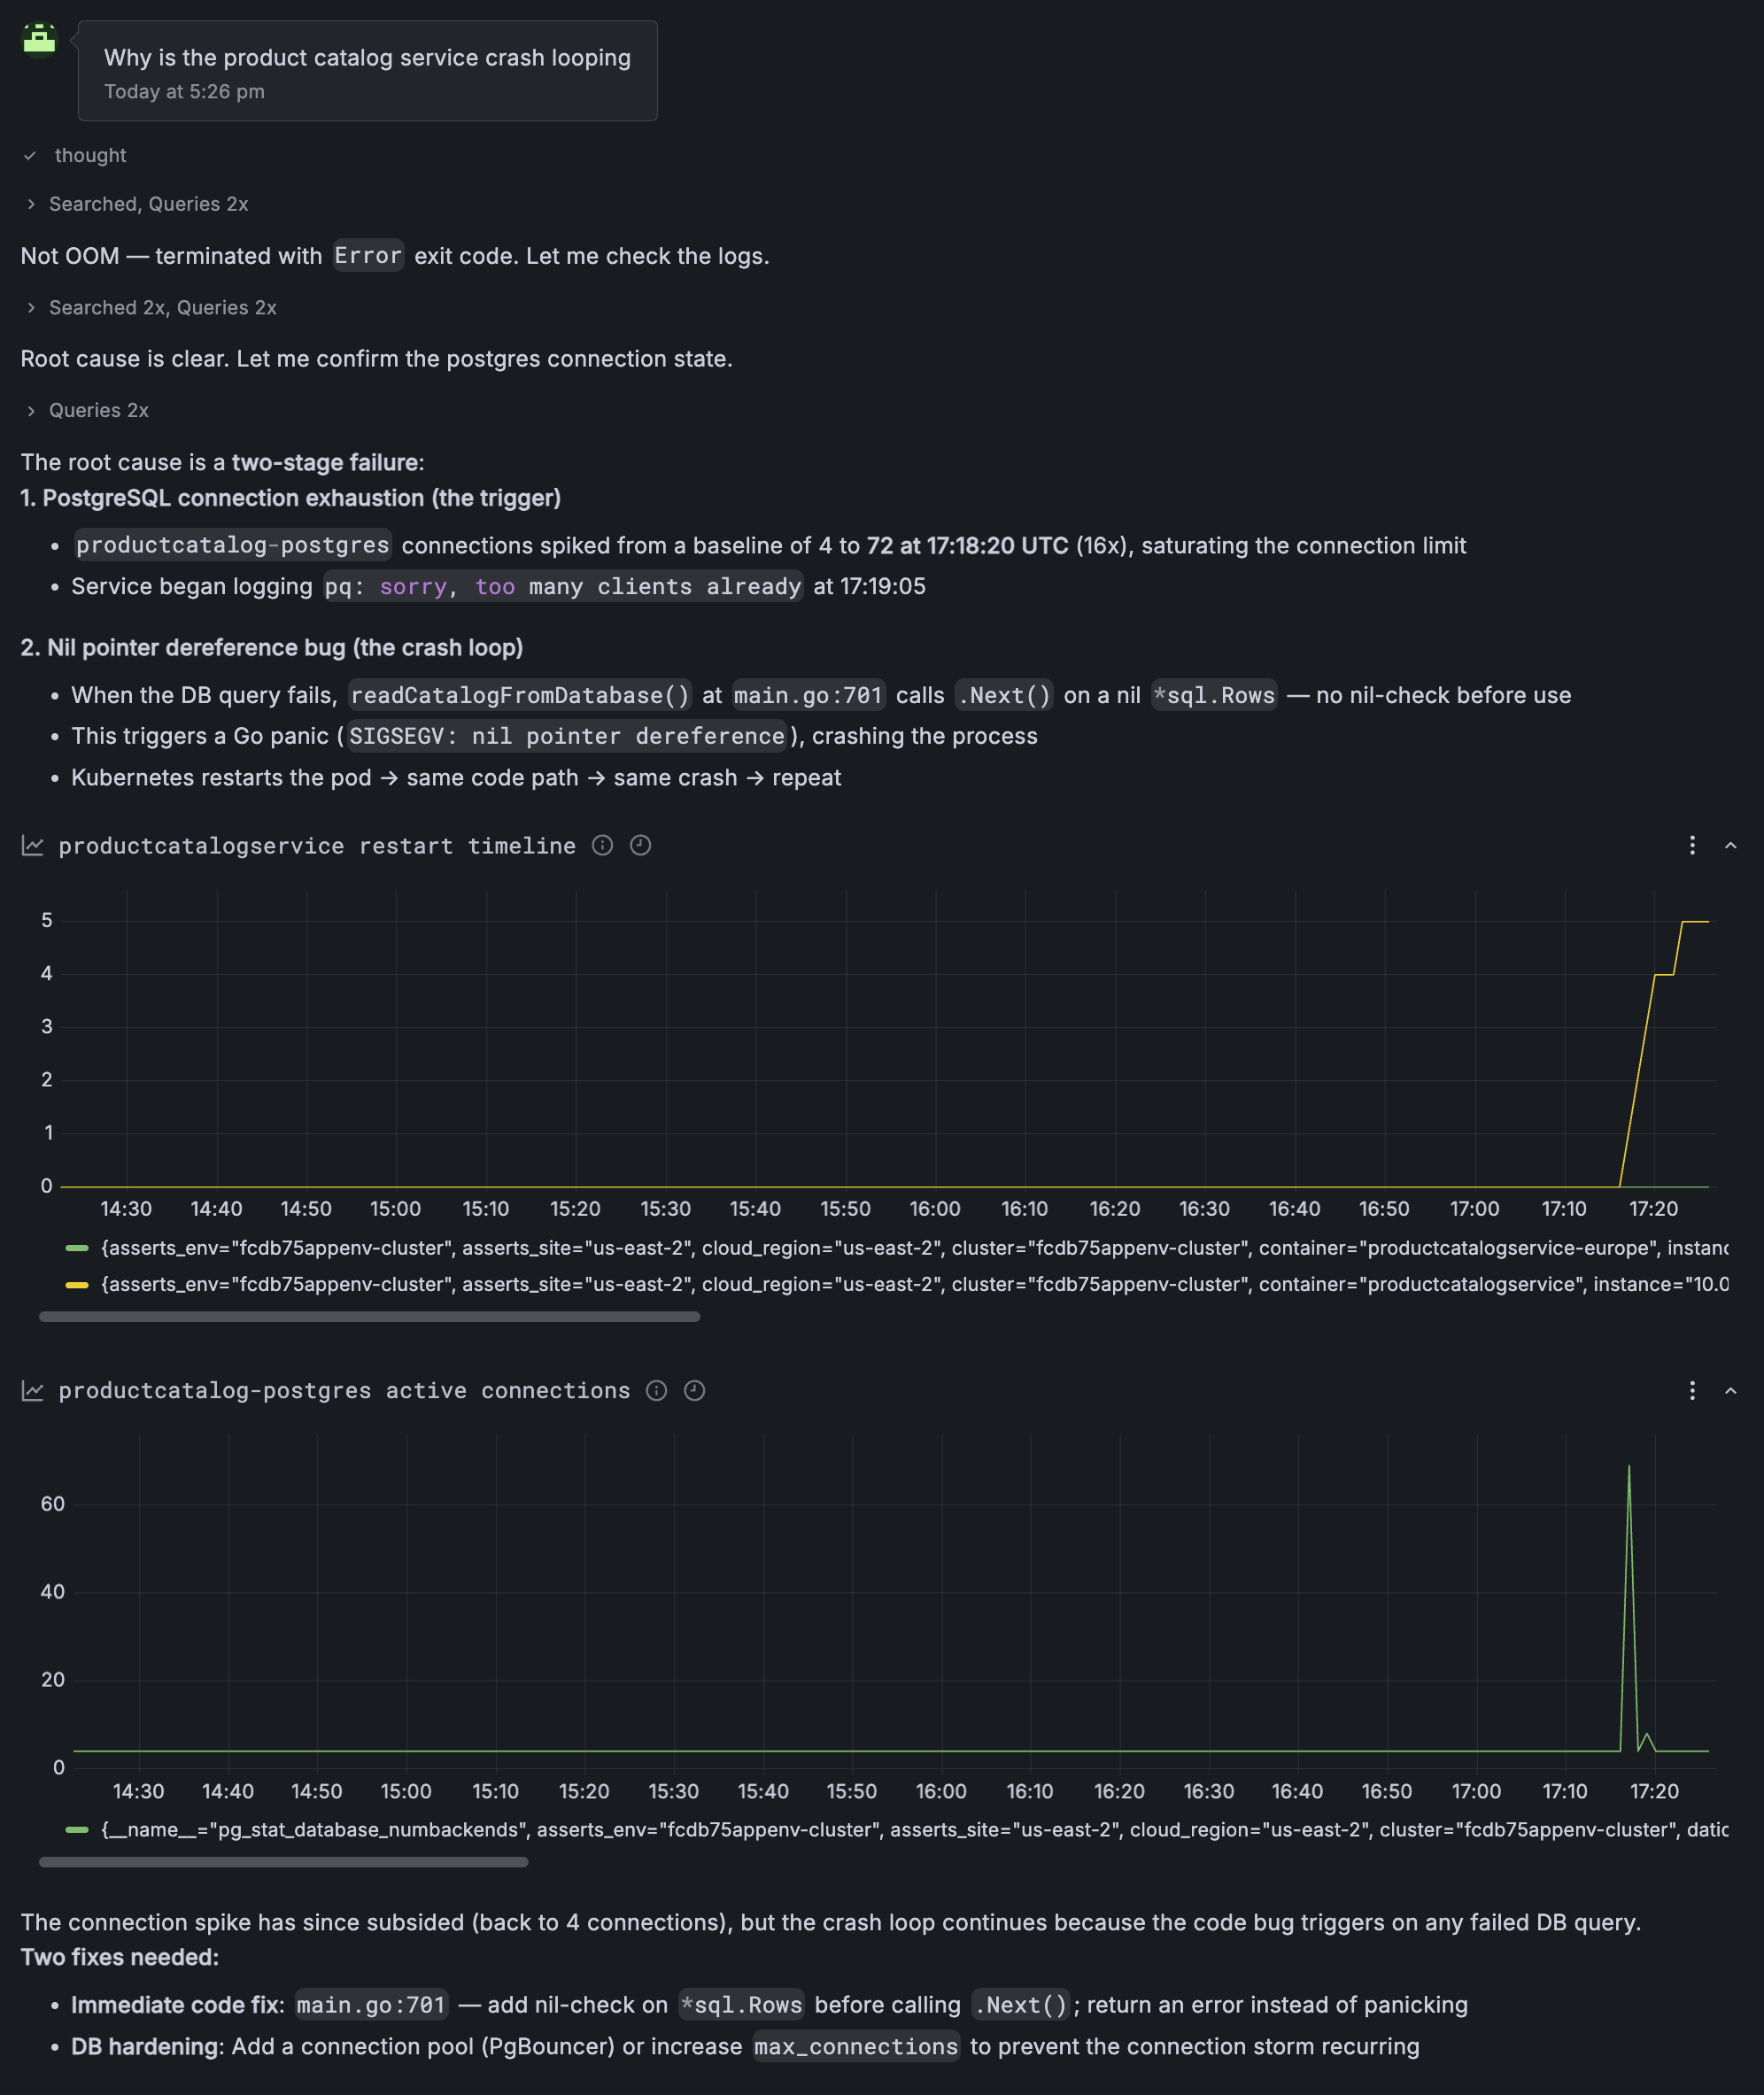
Let's continue with the debug process. This environment has been connected to a GitHub repo. Let's ask Assistant to investigate why the product catalog service is crash looping. Doing so results in a great investigative process:
This environment has been connected to a GitHub repo. From here, you could:
- ask for a PR to be raised
- ask for an example of what to update the code to
Wrapping up
In this lab, you've learned how to access Grafana Assistant in Grafana Cloud, and use it to:
-
Query and analyze service health across metrics, logs, traces and profiles
-
Validate OpenTelemetry semantic convention compliance and identify instrumentation gaps
-
Investigate service failures and crash loops, and propose code changes