3.3. Mission B: Enhance instrumentation
For this mission, you'll be taking your telemetry to the next level. The production team needs deeper insights into application behavior, and you'll be using the OpenTelemetry SDK to craft a custom metric and custom span attributes that deliver exactly what they need.
Let's dive in and see how a few lines of code can transform your monitoring capabilities.
Part 1: Add a custom metric
After the pain of the errors we saw in Lab 2, the operations team wants to be able to monitor how many times a game is won by either the computer or the player, or neither.
Define and increment the custom metric
Let's add a custom OpenTelemetry metric to expose this information:
-
Open gameserver.go in the code editor.
-
Update the imports at the top of the file, to add these opentelemetry packages:
"go.opentelemetry.io/otel/attribute"
"go.opentelemetry.io/otel/metric" -
Inside the
var()block, add these lines to declare a new meter object and variables to hold our counters:meter = otel.Meter(schemaName)
gamesStartedCounter metric.Int64Counter
gamesCompletedCounter metric.Int64Counter -
Now let's register two new counter metrics with the OpenTelemetry SDK. Add the following code after the var () block and before
type gameRequestfunc init() {
var err error
gamesStartedCounter, err = meter.Int64Counter(
"games.started",
metric.WithDescription("Number of games started"),
metric.WithUnit("{call}"),
)
if err != nil {
panic(err)
}
gamesCompletedCounter, err = meter.Int64Counter(
"games.completed",
metric.WithDescription("Number of games completed"),
metric.WithUnit("{call}"),
)
if err != nil {
panic(err)
}
} -
Now let's increment our "games started" counter.
Inside the
gameserver()function, after we've initialized the tracer (withtracer.Start()), add the following line. This will increment our "games.started" counter -- in other words, a counter of all games played, whether they completed successfully or not:gamesStartedCounter.Add(r.Context(), 1, metric.WithAttributes()) -
Now increment the counter after the call to getResult. The following line of code will increment the counter and add an attribute so that we can keep track of who won the game (which is stored in
resultCode):gamesCompletedCounter.Add(r.Context(), 1, metric.WithAttributes(attribute.String("winner", resultCode))) -
In a terminal, reformat your code:
go fmt -
Now re-run your app, and re-run the k6 load test, if it isn't running.
Wait a few moments for the new OpenTelemetry metrics to be generated and pushed to Grafana Cloud via Alloy.
Find your custom metric in Grafana
-
In Grafana, go to Drilldown -> Metrics.
-
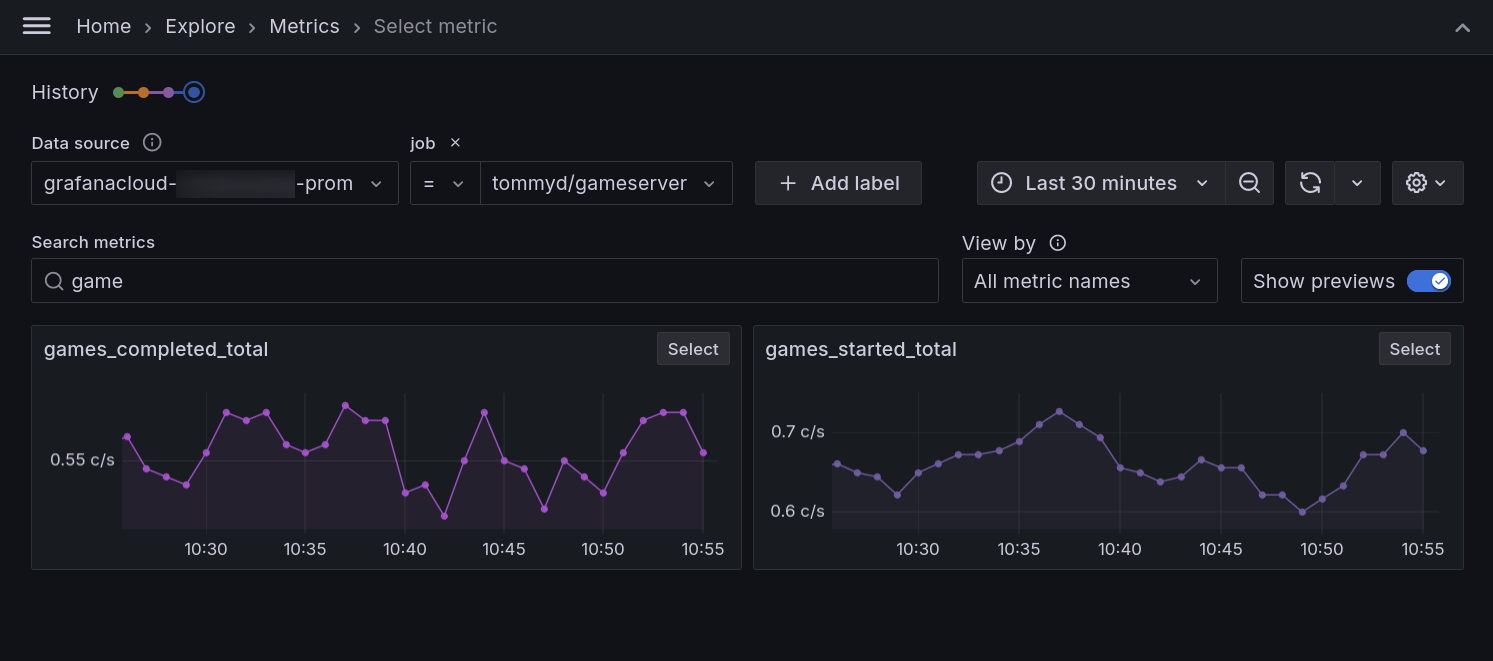
Search for the string game and add a filter for job = (your namespace)/gameserver.

Mimir and Prometheus use the
jobandinstancelabels, according the OpenTelemetry compatibility specification with Prometheus and OpenMetrics.This means that you can find your service using the
joblabel, which joins theservice.namespaceandservice.nameattributes together, e.g.mynamespace/myservice. -
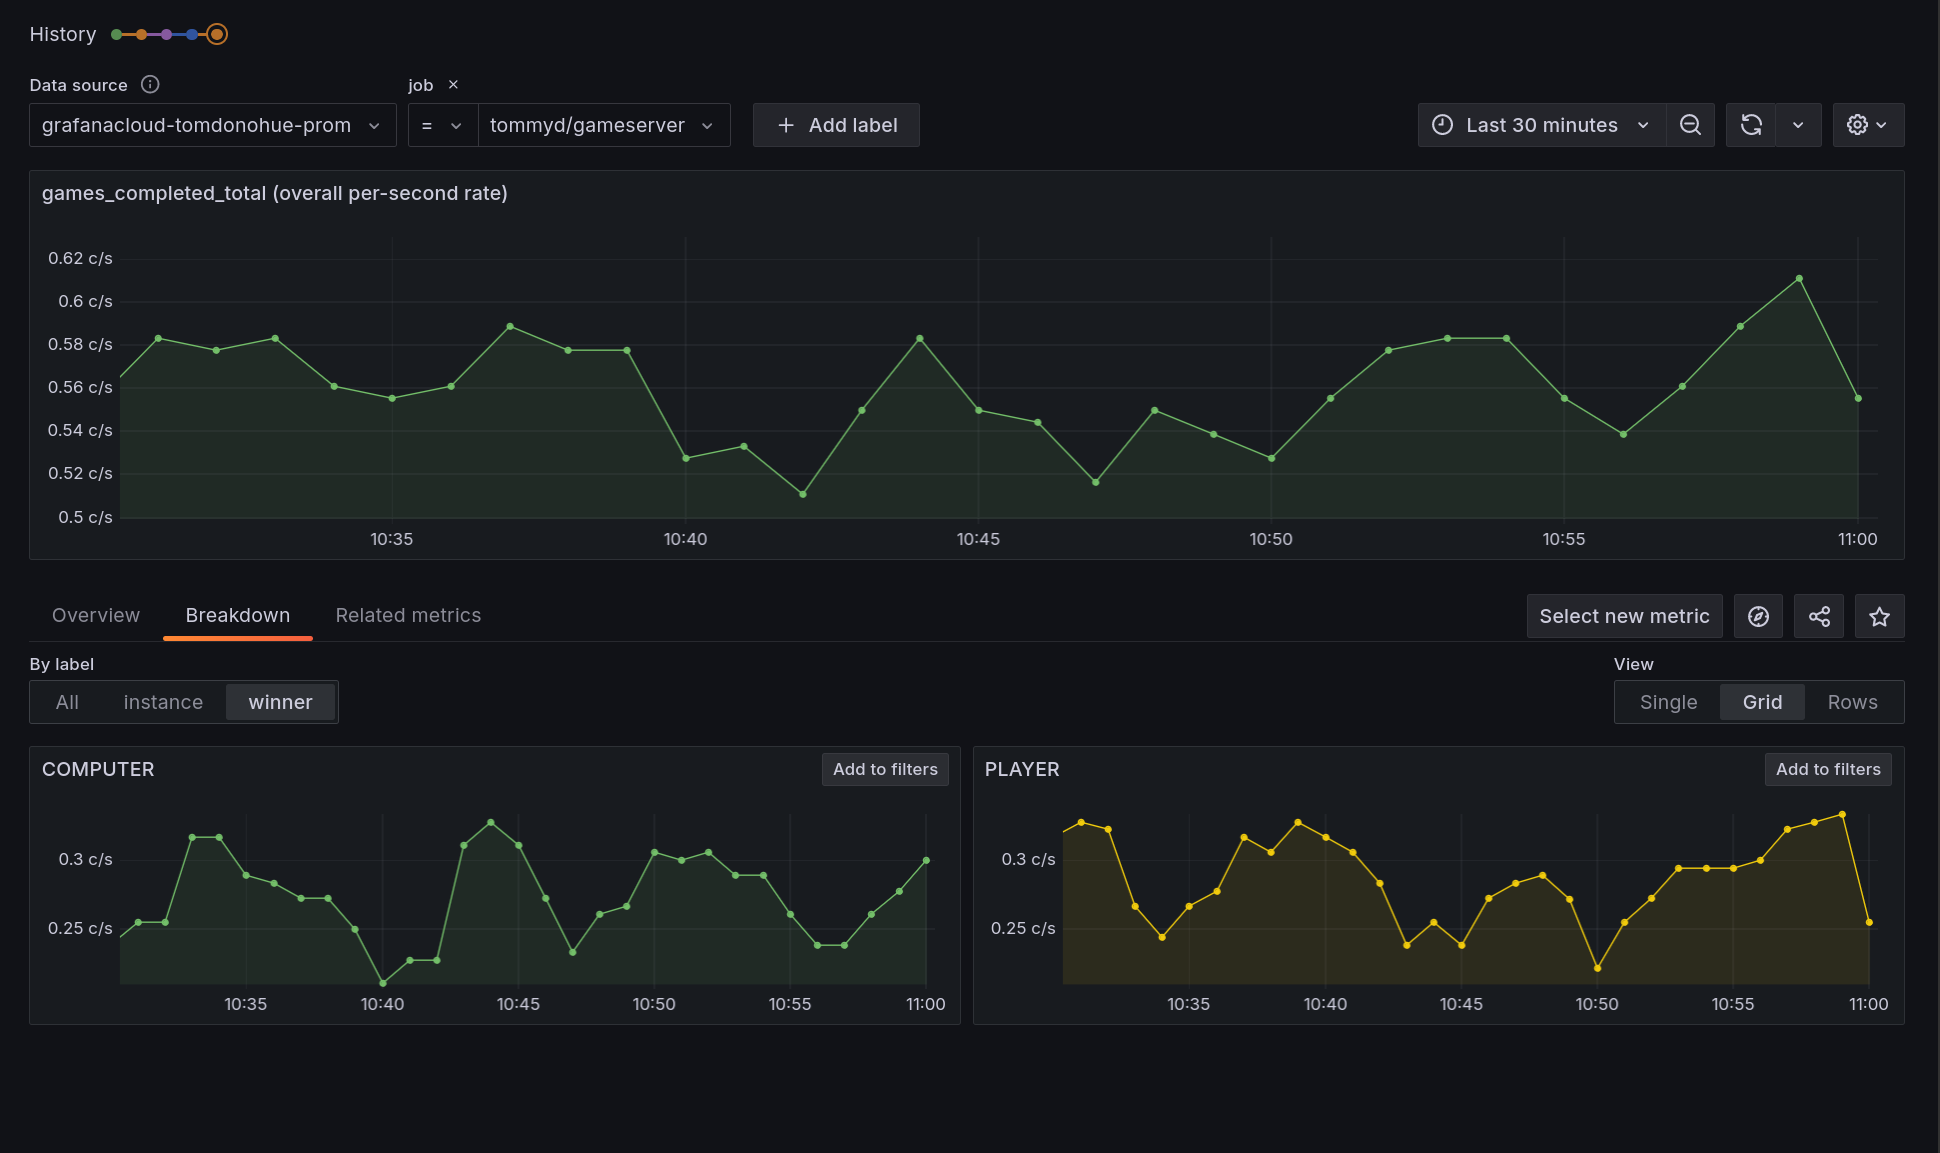
Click the games_completed_total metric, then click the winner label to see wins broken down by computer vs player.
This shows how your OpenTelemetry attribute (winner) appears as a Prometheus label, giving you a clear view of computer vs player victories. It almost looks like an even match!

Part 2: Add a custom span attribute
We can also add an attribute to a trace span. This helps to give further context about each request, which can be hugely useful in a troubleshooting situation.
-
Open the gameserver.go file in your Editor.
-
Before the line that increments
gamesCompletedCounter, insert the following lines:gameResultAttr := attribute.String("game.result", resultCode)
span.SetAttributes(gameResultAttr) -
Save the file, format your code with
go fmt, and restart the program by re-runningrun.sh. -
Wait a few moments for test data to be generated. Then, go to Grafana Cloud -> Explore and select your Traces data source.
Search for Traces:
-
Service name: gameserver
-
Tags: resource: service.namespace = (your namespace)
Then, click on the plus + button to add another tag filter:
- span: game.result = COMPUTER
-
-
Click on a Trace and then expand the span named play.
Expand the Span Attributes section. Notice how
game.resultis now recorded as a Span Attribute and it displays COMPUTER.Now we can instantly find traces relating to specific business scenarios in our application - in this case, finding traces where the computer won the game.
-
Q: What happens if you find all traces where
game.resultis neither PLAYER, nor COMPUTER? What results are returned?
See the completed code for gameserver.go
If you haven't managed to complete this exercise, but you'd like to "skip to the end", then you can replace your contents of gameserver.go with this source file, which includes the metrics and traces instrumentation code:
// gameserver.go - completed source file
package main
import (
"context"
"encoding/json"
"errors"
"fmt"
"io"
"log/slog"
"net/http"
"net/url"
"strconv"
"strings"
"go.opentelemetry.io/contrib/bridges/otelslog"
"go.opentelemetry.io/contrib/instrumentation/net/http/otelhttp"
"go.opentelemetry.io/otel"
"go.opentelemetry.io/otel/codes"
"go.opentelemetry.io/otel/attribute"
"go.opentelemetry.io/otel/metric"
)
var (
tracer = otel.Tracer(schemaName)
logger = otelslog.NewLogger(schemaName)
meter = otel.Meter(schemaName)

gamesStartedCounter   metric.Int64Counter
gamesCompletedCounter metric.Int64Counter
)
func init() {
    var err error

    gamesStartedCounter, err = meter.Int64Counter(
        "games.started",
        metric.WithDescription("Number of games started"),
        metric.WithUnit("{call}"),
    )
    if err != nil {
        panic(err)
    }

    gamesCompletedCounter, err = meter.Int64Counter(
        "games.completed",
        metric.WithDescription("Number of games completed"),
        metric.WithUnit("{call}"),
    )
    if err != nil {
        panic(err)
    }
}
type gameRequest struct {
Name string `json:"name"`
}
type gameResponse struct {
PlayerName string `json:"playerName"`
PlayerRoll int `json:"playerRoll"`
ComputerRoll int `json:"computerRoll"`
Result string `json:"result"`
}
func gameserver(w http.ResponseWriter, r *http.Request) {
ctx, span := tracer.Start(r.Context(), "play") // Begin a new child span called 'play'
gamesStartedCounter.Add(r.Context(), 1, metric.WithAttributes())
defer span.End()
var req gameRequest
if err := json.NewDecoder(r.Body).Decode(&req); err != nil {
logger.ErrorContext(ctx, "ERROR: Invalid request body: %v\n", err)
http.Error(w, "Invalid request body", http.StatusBadRequest)
return
}
msg := fmt.Sprintf("Player %s is playing", req.Name)
logger.InfoContext(ctx, msg, slog.String("player.name", req.Name))
playerRoll, err := rollDice(ctx, req.Name)
if err != nil {
logger.ErrorContext(ctx, "ERROR: Error while rolling dice: %v\n", err)
span.SetStatus(codes.Error, "Rolling player dice failed")
span.RecordError(err)
http.Error(w, "Error rolling dice", http.StatusInternalServerError)
return
}
computerRoll, err := rollDice(ctx, "Computer")
if err != nil {
logger.ErrorContext(ctx, "ERROR: Error while rolling dice: %v\n", err)
span.SetStatus(codes.Error, "Rolling computer dice failed")
span.RecordError(err)
http.Error(w, "Error rolling dice", http.StatusInternalServerError)
return
}
resultCode, resultString, err := getResult(playerRoll, computerRoll)
gameResultAttr := attribute.String("game.result", resultCode)
span.SetAttributes(gameResultAttr)
gamesCompletedCounter.Add(r.Context(), 1, metric.WithAttributes(attribute.String("winner", resultCode)))
msg2 := fmt.Sprintf("Game result was %s", resultCode)
logger.InfoContext(ctx, msg2)
if err != nil {
logger.ErrorContext(ctx, "ERROR: Error while calculating result")
span.SetStatus(codes.Error, "getResult failed")
span.RecordError(err)
http.Error(w, "Error while calculating result", http.StatusInternalServerError)
return
}
resp := gameResponse{
PlayerName: req.Name,
PlayerRoll: playerRoll,
ComputerRoll: computerRoll,
Result: resultString,
}
w.Header().Set("Content-Type", "application/json")
json.NewEncoder(w).Encode(resp)
}
func rollDice(ctx context.Context, name string) (int, error) {
baseURL := "http://localhost:8080/rolldice"
params := url.Values{}
params.Add("player", name)
url := fmt.Sprintf("%s?%s", baseURL, params.Encode())
// Create a new client and wrap it with a span, injecting the span context into the outbound headers
client := http.Client{Transport: otelhttp.NewTransport(http.DefaultTransport)}
req, _ := http.NewRequestWithContext(ctx, "GET", url, nil)
resp, err := client.Do(req)
if err != nil {
return 0, err
}
defer resp.Body.Close()
body, err := io.ReadAll(resp.Body)
if err != nil {
return 0, err
}
roll, err := strconv.Atoi(strings.TrimSpace(string(body)))
if err != nil || roll < 1 || roll > 6 {
return 0, fmt.Errorf("invalid dice roll: %s", body)
}
return roll, nil
}
func getResult(playerRoll, computerRoll int) (string, string, error) {
switch {
case playerRoll > computerRoll:
return "PLAYER", "You win!", nil
case playerRoll < computerRoll:
return "COMPUTER", "Computer wins!", nil
default:
return "", "", errors.New("No winner - unexpected tie between players!!")
}
}
Wrapping up
In this mission, you've seen:
-
How to add valuable context to your telemetry, using the OpenTelemetry SDK
-
How OpenTelemetry custom span attributes are stored and searchable in Tempo and Grafana Cloud Traces.
-
How to search for an OpenTelemetry custom metric using Prometheus, Grafana Cloud Metrics and Metrics Drilldown.
You've finished! What next?
Now that you've unlocked the power of OpenTelemetry auto instrumentation, imagine the possibilities for enriching your telemetry data with custom insights that matter most to your applications.
OpenTelemetry's rich toolkit and APIs are your gateway to crafting deeper, more meaningful observability - the kind that transforms raw data into actionable intelligence.
What valuable stories could your telemetry data tell with just a few lines of custom instrumentation?