1.1 Create a dashboard, fast
Step 1: Create your personal folder
You're sharing a Grafana Cloud workspace with your team today. So let's create a folder for your personal use.
- Click on the menu icon to open the sidebar, and click Dashboards.
- Click the New dropdown and then click New Folder.
- Enter a name for your folder, such as your initials or username.
- Click Create, and you will be redirected to your new folder.

Organizing your dashboards into folders helps keep your Grafana instance tidy and makes it easier to find what you need.
Step 2: Create a dashboard with Grafana Assistant
Now let's create the initial dashboard. We want to show the number of frontend sessions and the number of checkout orders, along with a couple of other relevant panels. Grafana Assistant can help you create this dashboard in seconds.
Assistant works inside its panel on the right-hand side of the screen. When you send a prompt, it inspects your available data sources, writes the queries, and assembles the panels for you — narrating each step as it goes.
While Assistant is working:
- Stay on this page. Don't navigate away or refresh the browser, or Assistant will lose its progress.
- Let it drive. Leave the left-hand navigation menu and the dashboard alone until it finishes.
- You'll know it's done when it stops streaming text, gives you a short summary of what it built, and the finished dashboard appears behind the panel.
This first dashboard can take a minute or two to build. That's normal.
-
From the side menu, click Assistant.
-
Enter the following prompt to create a dashboard:
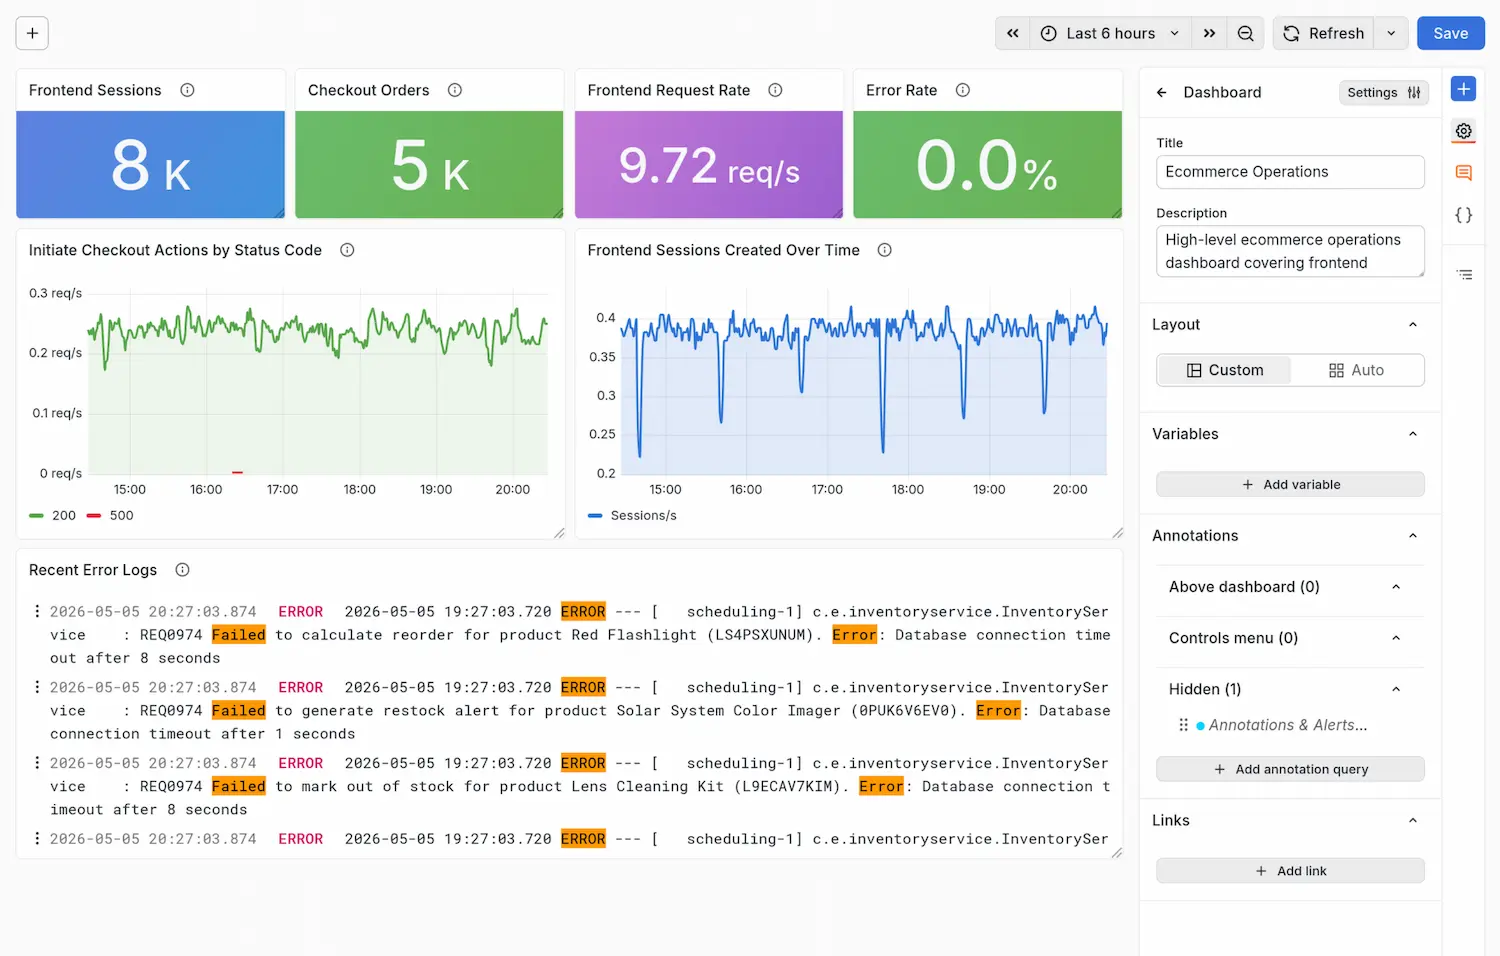
Suggested promptPlease create an operations dashboard for my ecommerce application.Give high level stats for the number of frontend sessions, the number of checkout orders, rate of frontend requests and percentage of errors (non-2xx status codes).Show two time series: frontend initiate-checkout actions (broken down by status code) and frontend sessions created over time.Please also add a panel which shows recent error logs from Loki.Wait for Grafana Assistant to create the dashboard.
-
Once Assistant has finished, review the dashboard and rearrange any panels how you like them.
Your finished dashboard should look something like this:
Need to fix something?
If Assistant has created some panels that you don't like, or the panels are showing No Data, you can guide it with a further corrective prompt, like this:
Suggested prompt (optional)Panel <X> is showing No Data. Can you fix it? -
Once you're happy with your dashboard, save your changes by clicking Save, then select your personal folder, and click the Save button.
Not using Grafana Assistant? Click here.
If you're not using Grafana Assistant to create your dashboard, you can import a starter dashboard which has been pre-installed into the environment for you:
-
From the search bar in Grafana at the top of the screen, search for the dashboard Ecommerce Operations (Starter) and open it.
-
Once the dashboard has loaded, click Edit and then Save as copy to save to your personal folder.
What's next
Next, we'll load up the dashboard with context and data.