2.1 Combine data with Expressions
Grafana can calculate new metrics from your existing data — combining values from different sources, without changing anything in your databases or building a pipeline.
Can you help us quickly understand conversion rates?
I think we have the right data, but it seems to be in two different places.
Task 1: Calculate revenue per session
Feature: Math expressions
Revenue and sessions live in two completely separate systems — MySQL and Prometheus. A Math expression lets you perform arithmetic across the results of multiple queries, entirely in-memory. No ETL, no data warehouse, no new pipeline.
We'll use it to calculate Revenue per Session (RPS): how much revenue, on average, each visitor is generating.
Revenue per session = total revenue ÷ total number of sessions
Add the two sources of data
-
Click the Add new element icon (the blue plus sign) in the top-right corner, then click or drag a panel onto the dashboard.
-
Set the Title to
Revenue per session, then click Configure to open the panel editor. -
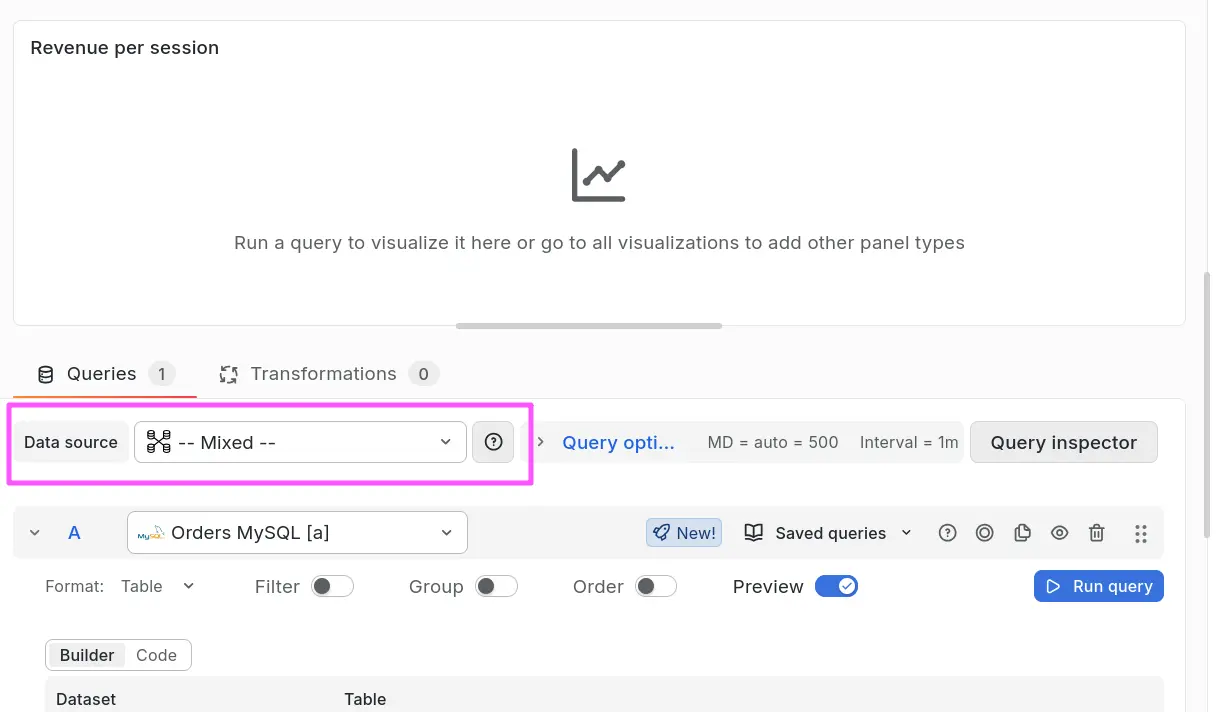
In the Queries tab, change the datasource to Mixed, as we will be querying both MySQL and Prometheus.
-
In the first query row (labeled A):
-
Change the datasource to Orders MySQL.
-
Switch the query editor to Code mode.
-
Paste this SQL (you might recognize this! It's the same query we used to calculate total revenue in Lab 1):
SELECT SUM(total_amount) AS revenueFROM orders.ordersWHERE $__timeFilter(order_date)
-
-
Click the Add query button (underneath your first query) and then configure the new query (labeled B):
-
Change the datasource to grafanacloud-xxxxx-prom (Prometheus).
-
In the Options bar, set the query type to Instant. ⚠️
-
Paste this PromQL (Prometheus) query:
sum(increase(app_frontend_sessions_created_total[$__range]))
-
Combine them with a Math expression
-
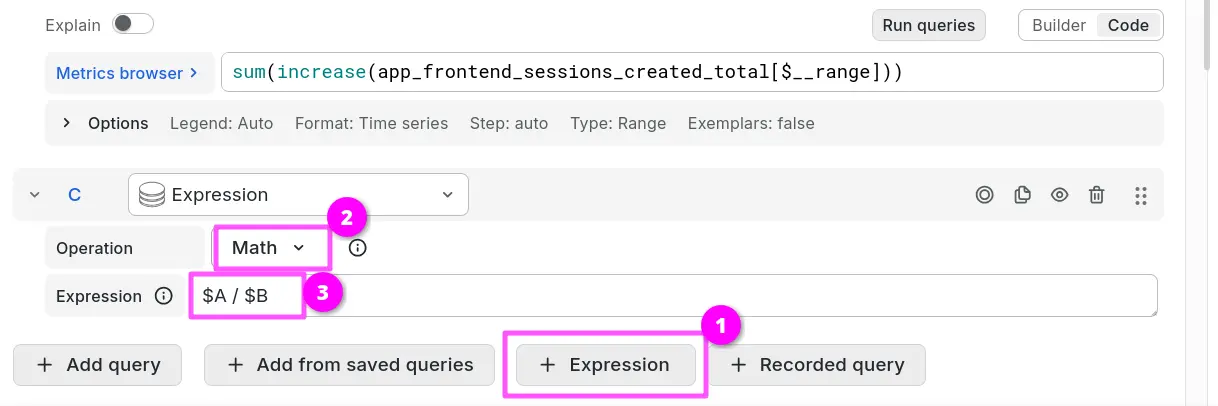
Click the Expression button and select Math from the menu.
-
In the expression field, enter:
$A / $B How it works
$Aand$Bare references to the results of queries A and B. Grafana evaluates the expression in-memory against those results. -
Click the eye icon on queries A and B to hide them, so only the expression result is visualized.
-
Change the visualization type to Stat. The picker opens on the Suggestions view — click All visualizations first, then choose Stat. (Search doesn't work while you're in the Suggestions view.)
Style it out
-
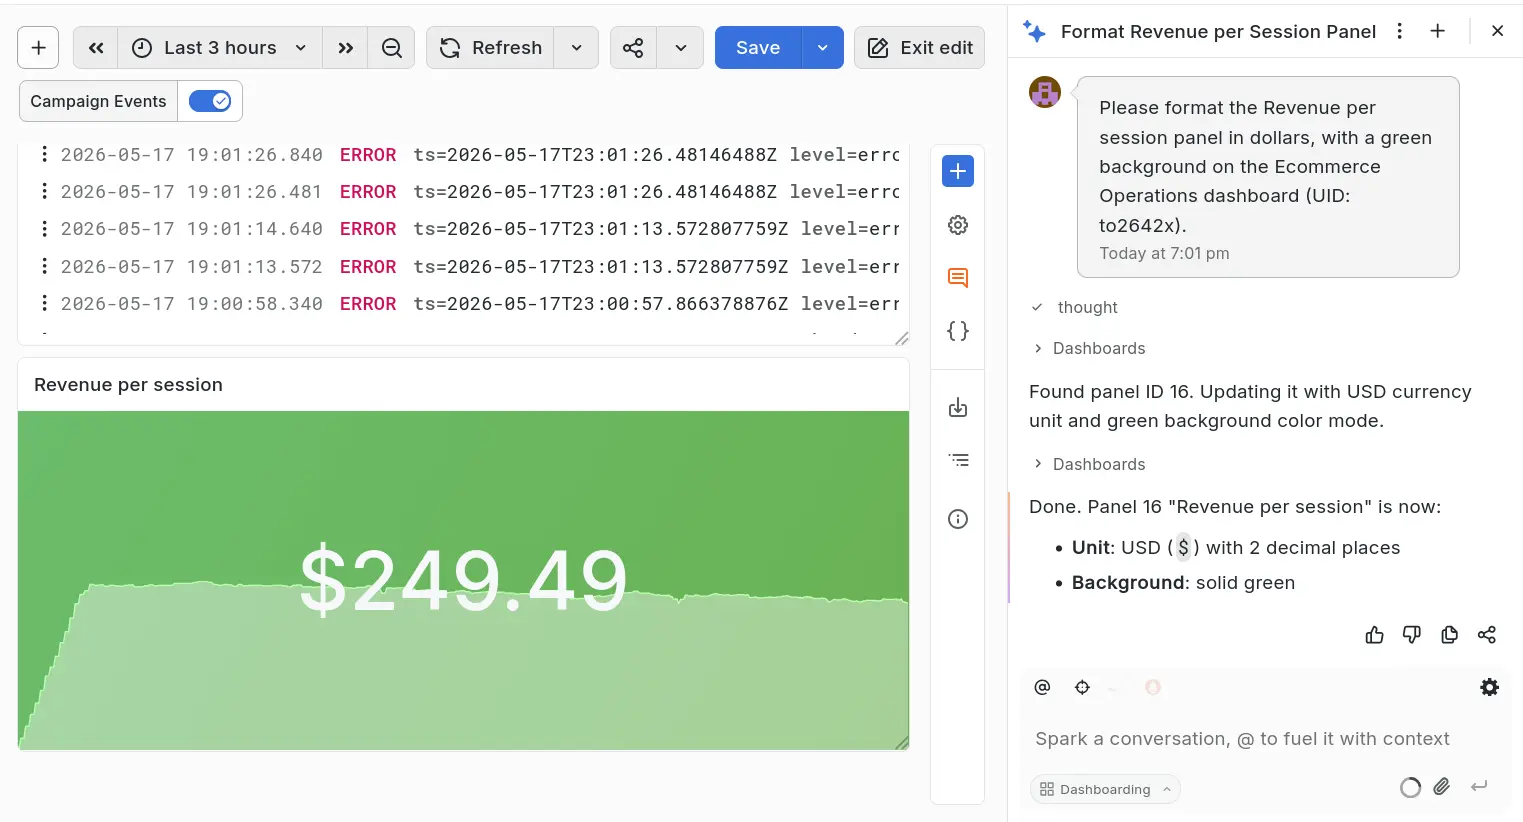
Now, style the panel to make it clear and visually appealing. We can use Grafana Assistant to do this quickly with natural language:
Suggested promptPlease format the Revenue per session panel in dollars, with a green background. -
Click Back to dashboard.
You now have a single Stat panel showing the average revenue each visitor generates — one number, drawn from two completely separate backends.
Curious how to style this panel without Grafana Assistant?
You can set the following properties using the panel editor. Use the search function in the panel editor to quickly find properties by name:
| Search for | Set property | To value |
|---|---|---|
unit | Standard options -> Unit | Currency -> Dollars ($) |
color | Stat styles -> Color mode | Background Solid |
color | Color scheme | Single color |
color | Color | Green |
Task 2: Compare sessions vs completed orders
Feature: SQL Expressions, Library Panels
These numbers look good overall, but I wonder if it varies by market?
Could we see sessions vs. completed orders broken down by geography?
This data exists, but it's in two different data sources: frontend sessions are tracked with a Prometheus metric, but completed orders are stored in the database. We'll use a SQL Expression to join the two together.
Rather than building the panel from scratch, we've prepared it as a Library Panel — a pre-built panel that can be imported into any dashboard. Library panels are how teams share and reuse visualizations across Grafana without duplicating work.
Import the Orders vs Sessions panel
- Click the + (Add new element) icon in the top right corner, then click the empty panel and drag it onto the dashboard.
- On the new panel, click Use library panel.
- Search for Orders vs Sessions by Geography and click to select it.
- Drag it into position on the dashboard alongside your other panels.
- Click Save.
What does the chart tell us?
For each geography, the chart shows two bars side by side: sessions (how many visitors arrived) and completed orders (how many actually bought something).
The gap between those two bars is the regional conversion rate, made visible:

One market should stand out immediately. GB's sessions bar is comparable in height to other markets — it's getting traffic. But its completed orders bar is noticeably smaller than you'd expect. Something is stopping GB visitors from completing purchases.
This panel uses a SQL Expression — a Grafana feature that runs an in-memory SQL JOIN across the results of multiple queries. Sessions come from Prometheus, orders come from MySQL, and Grafana joins them without either system knowing about the other. No data pipeline required.
If you're curious, open the panel editor and look at the Queries tab to see how it's constructed.
All users share library panels in a Grafana instance. If you want to make your own edits to the panel, go ahead! But first, edit the panel and click the Unlink library panel button at the top. This will keep your edits private.
Wrapping up
In this section you've seen two ways that Grafana can act as a calculation layer on top of your existing data:
- Math expressions — arithmetic across query results from different backends. Simple, fast, and no SQL needed.
- SQL expressions — full in-memory SQL across multiple sources. Powerful enough to join a relational database with a time-series system in a single panel.
Neither approach requires touching your data sources, modifying schemas, or building new infrastructure.
Expressions have also helped us to spot something worth investigating: GB's conversion rate is lower than every other market.
In the next section, you'll add filters to drill into exactly what's happening there.
Click Next to continue.