2.2 Filter and investigate
You've spotted that GB's conversion rate is lower than every other market. Now you need to filter the dashboard to focus on GB specifically — and find out what's actually going wrong.
That bar chart makes it really clear that GB is underperforming.
Is there any way we can filter the whole dashboard to just show GB data? I want to dig into what's happening there.
The answer is dashboard variables — dropdowns that filter every panel on the dashboard simultaneously. You'll add one for geography.
Task 1: Add geography variable
Feature: Dashboard variables
Create the $geography variable
-
Click the gear icon (Dashboard settings, top-right) → Variables → + Add variable.
-
Configure the variable:
- Type: Query
- Name:
geography - Label:
Geography - Multi-value: enabled
- Include All value: enabled
-
Click Open variable editor and configure the query:
-
Data source: Orders MySQL
-
Query:
SELECT DISTINCT country FROM orders.customersWHERE country IS NOT NULL AND country != 'Not Set - Default'ORDER BY country -
Refresh: On dashboard load
-
-
Click Preview to confirm countries appear, then click Save.
Wire the variable into the panel
The second part of setting up a variable is wiring it into the relevant panels. In this case, we'll do one panel together, and then you can apply the same logic to any other panels you want to filter by geography.
-
Click the Initiate Checkout Actions by Status Code panel → Edit.
-
In the query editor, find the label selectors in the PromQL query. They are the entries inside braces, like this:
{ ... }.Add the
page_attr_geographyvariable filter into the label selectors, using Grafana'sregexkeyword which allows for multiple selections. Here's the syntax:page_attr_geography=~"${geography:regex}"Your query should now look like this:
sum by(event_data_http_status_code) (feo11y:frontend_actions_requests:rate5m{action_name="initiate-checkout",page_attr_geography=~"${geography:regex}"}) -
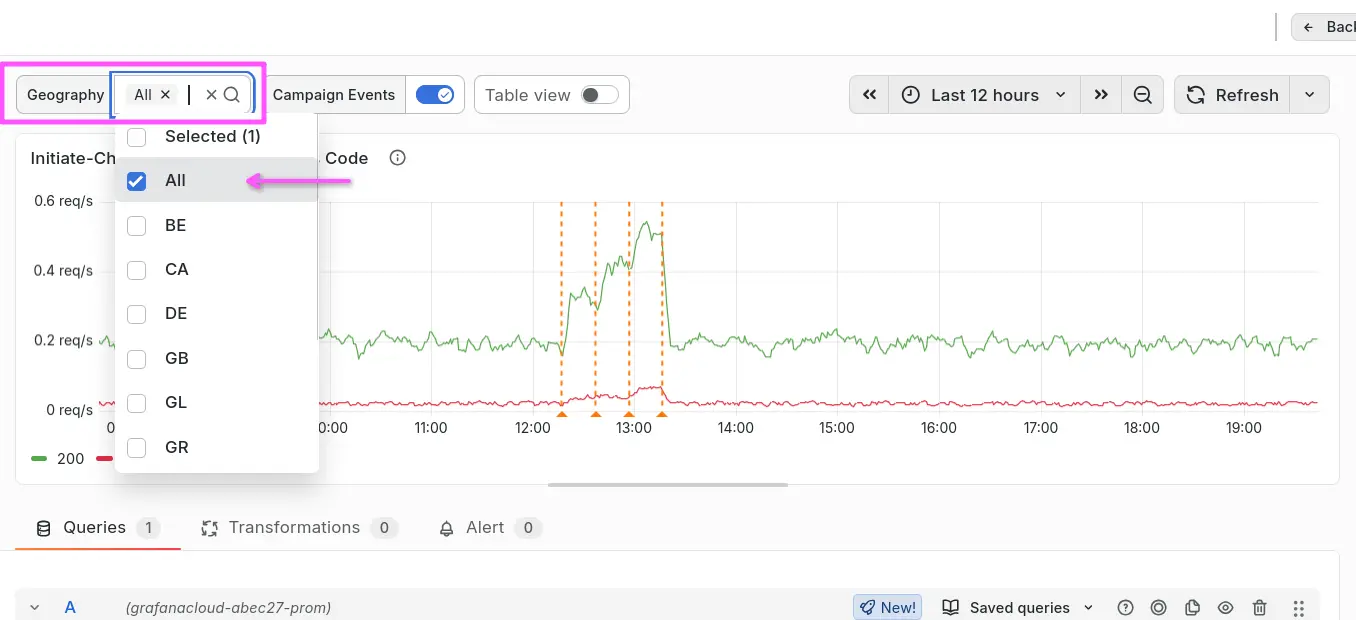
Important: Find the Geography dropdown in the top left, and select the All option. Let's view all geographies together first, before we filter down to GB.
-
Click Back to dashboard, then Save the dashboard.
Task 2: Use the variable to investigate one country
Feature: Dashboard variables
Now you'll wire the variable into the Initiate Checkout Actions by Status Code panel, and use it to surface what's actually happening in GB.
Note the current error rate
Before you make any changes, look at the Initiate Checkout Actions by Status Code (or similarly named) panel on your dashboard and note the current ratio of error responses (4xx/5xx) to successful ones (2xx). This is the aggregate view across all geographies.
Filter to GB and observe
-
Set the Geography dropdown to
GB. -
Look at the Initate Checkout Actions by Status Code panel again.
The error rate should be noticeably higher than what you saw before. In the aggregate view of all requests, GB's errors were diluted, because of successful traffic from every other territory. But, when the graph is scoped to GB only, the signal is clear - users in this country are experiencing elevated error rates:
This is the value of segment-level filtering over aggregate dashboards: the problem was always there — it just wasn't visible until you looked at the right slice of data.
Wrapping up
You've turned a static dashboard into an interactive investigation tool. By adding a variable and wiring it into a panel, you've gone from "GB's conversion is low" to "GB has an elevated error rate" — and you didn't leave Grafana.
In the next lab, you'll take this one level deeper: find the specific orders affected by those errors, and take action on them directly from the dashboard.
Click Next to continue.