1.2. Pull-based Telemetry
We'll be working with both push and pull-based telemetry in this workshop. We'll be using the pull model for Prometheus metrics, Kubernetes pod logs, and Pyroscope profiles. This requires discovering a list of targets, then configuring scrapers to collect telemetry from each one.
Step 1: Discover Kubernetes Pods
Our QuickPizza application is running in Kubernetes, meaning we can take advantage of Alloy's discovery.kubernetes component to discover all of the pods that compose our application. Let's open up our fleet pipeline and get started!
These Grafana Alloy docs may prove useful as you configure service discovery:
- discovery.kubernetes component reference
- Pod labels returned by
discovery.kubernetes - discovery.relabel component reference
-
Navigate to Connections -> Collector -> Fleet Management in the left-hand menu.
-
You will land on the Inventory page, where you will see the Alloy instance assigned to you.
Click the Remote Configuration tab to list the pipelines we have configured.
-
Click the Edit (pencil icon) button next to the lab_scrape_telemetry pipeline to open the partially built pipeline we'll be modifying.
-
In the
discovery.kubernetescomponent, add a namespace selector to return only pods in thequickpizzanamespace below theTODOcomment.See the solution
  namespaces {
    names = ["quickpizza"]
} -
In the
discovery.relabelcomponent, add a new rule to set the pod's name as the labelpod.See the solution
  rule {
    source_labels = ["__meta_kubernetes_pod_name"]
    target_label  = "pod"
} -
In the
discovery.relabelcomponent, add a new rule to set the pod container's name as the labelcontainer.See the solution
  rule {
    source_labels = ["__meta_kubernetes_pod_container_name"]
    target_label  = "container"
} -
In the
discovery.relabelcomponent, add a new rule to set the value of the pod labelapp.kubernetes.io/instanceas the labelservice_name.See the solution
  rule {
    source_labels = ["__meta_kubernetes_pod_label_app_kubernetes_io_instance"]
    target_label  = "service_name"
} -
Click the Test configuration pipeline button to validate the config.
-
Click the Next button to move to the next step.
-
No changes are needed to the assigned attributes, so click the Save button.
-
From the Remote configuration screen, click the toggle icon under Active for the lab_scrape_telemetry pipeline.
-
In the modal that pops up, click the Activate button.
Check your work
Now that we have service discovery configured for our Kubernetes cluster, let's check the Alloy UI to see what it found.
-
Open the browser tab for the Grafana Alloy UI and click Remote Configuration in the top navigation.
-
Click the View button next to the lab_scrape_telemetry.default pipeline.
-
Click the blue Graph button just below the name of the pipeline on the details page.
-
Verify you see boxes for the
discovery.kubernetesanddiscovery.relabelcomponents. (You can ignore theremote.kubernetes.secretblock as we haven't used it yet)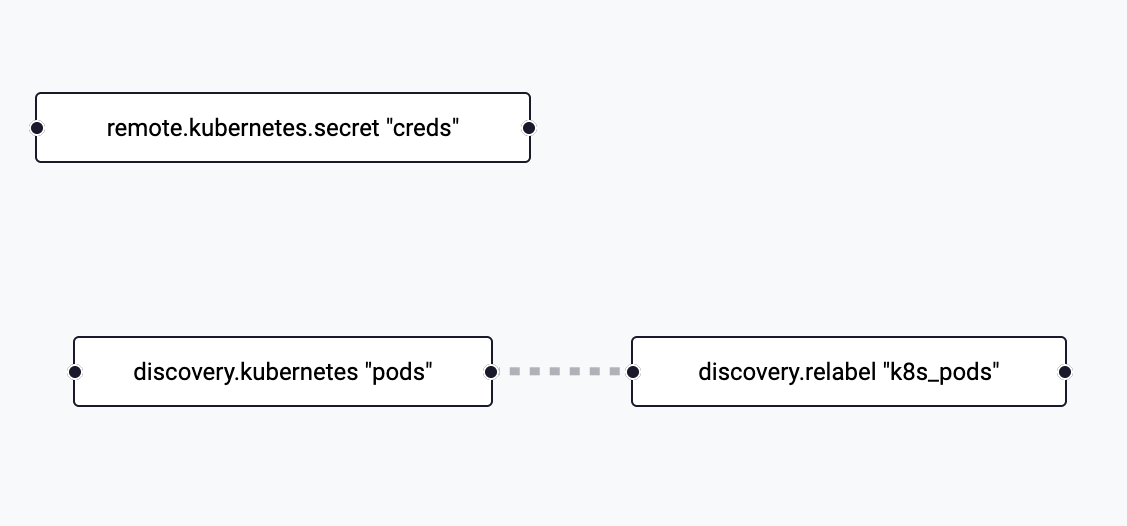
-
Click the box for the
discovery.relabelcomponent. -
Click the Exports link in the left navigation.
-
Review the outputted targets and confirm you see the labels we added such as pod, container, and service_name.
Step 2: Scraping Metrics
Now that we have all of our QuickPizza application pods discovered, we're ready to configure Alloy to scrape Prometheus metrics from the application pods. By default, Alloy will scrape the /metrics path via HTTP on each port exposed by each pod.
These Grafana Alloy docs may prove useful as you scrape metrics:
- prometheus.scrape component reference
- discovery.relabel exported fields
-
Navigate to Connections -> Collector -> Fleet Management in the left-hand menu.
-
Click the Remote Configuration tab to list the pipelines we have configured.
-
Click the Edit (pencil icon) button next to the lab_scrape_telemetry pipeline to open the partially built pipeline we'll be modifying.
-
Paste the contents below under the Prometheus Metrics section in the pipeline.
This code includes a fully fleshed out
prometheus.remote_writecomponent using credentials from a Kubernetes secret and a partialprometheus.scrapecomponent.prometheus.scrape "app" {
// TODO: Use the output of the relabled pods
// TODO: Forward to Grafana Cloud Metrics
// TODO: Set scrape interval to 15s
}
prometheus.remote_write "grafana_cloud" {
endpoint {
url = convert.nonsensitive(remote.kubernetes.secret.creds.data["metrics_url"])
basic_auth {
username = convert.nonsensitive(remote.kubernetes.secret.creds.data["metrics_user"])
password = remote.kubernetes.secret.creds.data["access_token"]
}
}
} -
In the
prometheus.scrapecomponent, configure the target to use the output of our relabeled pods from the previous section. (Hint: look at the docs to find the exported fields for thediscovery.relabelcomponent)See the solution
targets = discovery.relabel.k8s_pods.output -
In the
prometheus.scrapecomponent, configure forwarding to the receiver ofprometheus.remote_write.grafana_cloud.See the solution
forward_to = [prometheus.remote_write.grafana_cloud.receiver] -
In the
prometheus.scrapecomponent, set the scrape interval to 15s.See the solution
scrape_interval = "15s" -
Click the Test configuration pipeline button to validate the config.
-
Click the Save button to apply it.
-
In the modal that pops up warning that your pipeline is active, click Save again.
Check your work
With metrics flowing, let's see what Alloy's live debugging shows.
-
Open the browser tab for the Grafana Alloy UI and click Remote Configuration in the top navigation.
-
Click the View button next to the lab_scrape_telemetry.default pipeline.
-
Click the blue Graph button just below the name of the pipeline on the details page.
-
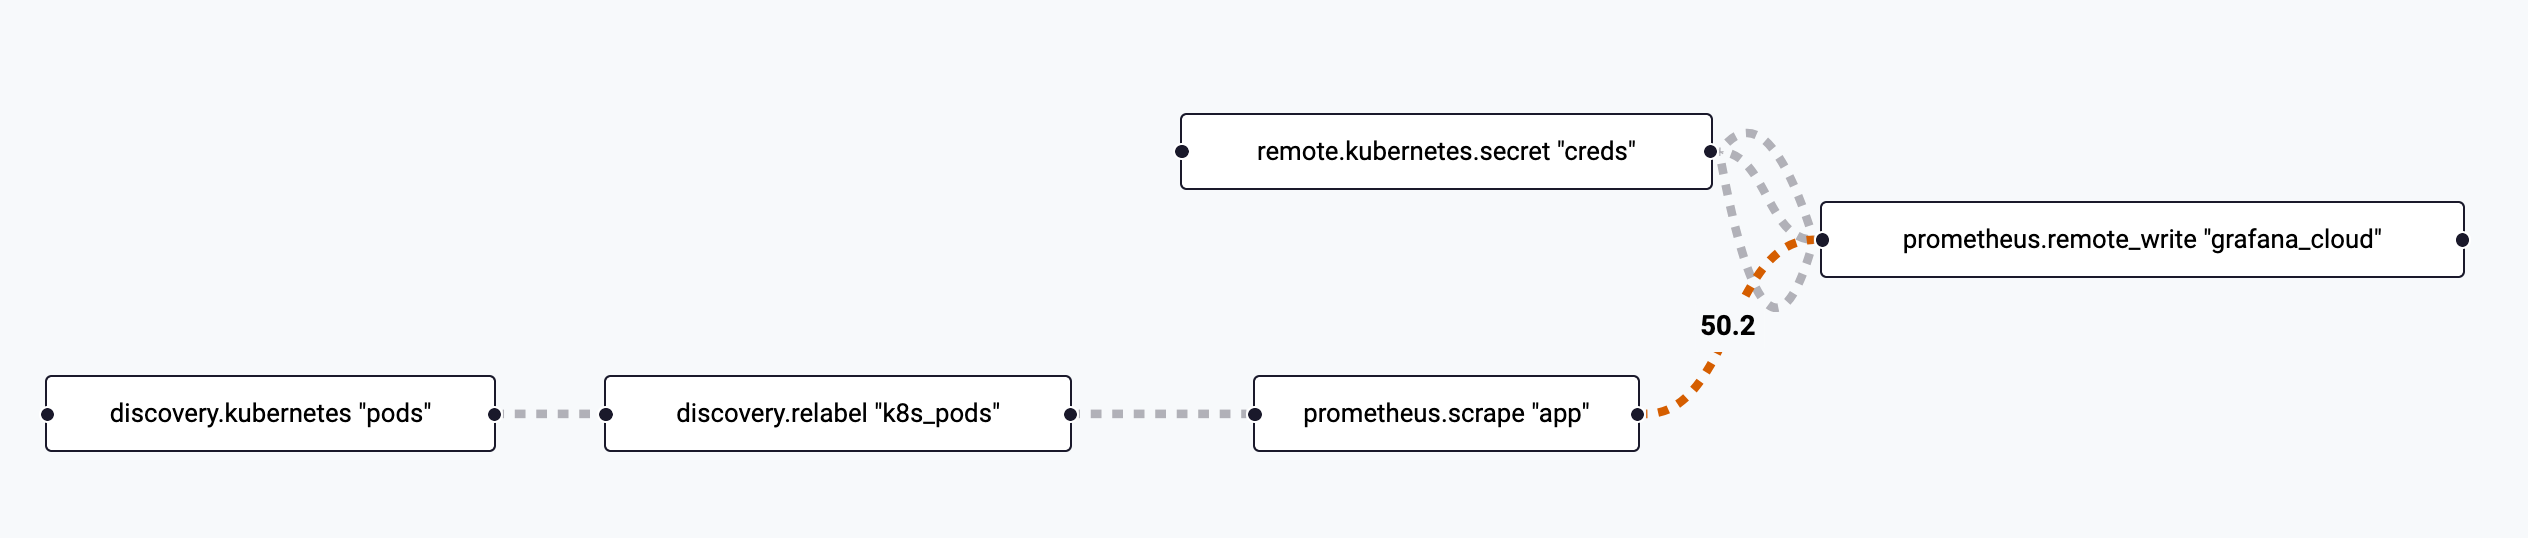
Verify you see the boxes for the newly added Prometheus components.
-
Click the box for the
prometheus.scrapecomponent. -
Click the Live Debugging button near the top of the page.
-
Watch for metrics to appear as they are scraped from the targets by Alloy (within 15 seconds).
-
Bonus: From the Grafana UI, navigate to Drilldown > Metrics and see if you can find the newly scraped metrics that begin with k6quickpizza_
Step 3: Collecting Logs
The next signal we'll focus on is logs. Alloy has many ways to accept logs (OpenTelemetry, Syslog, Docker, log files, etc), but we will be using the Kubernetes API due to some of the unique constraints of this workshop.
These Grafana Alloy docs may prove useful as you collect logs:
- loki.source.kubernetes component reference
- discovery.relabel exported fields
-
Return to the fleet pipeline you were working with in the previous step.
-
Paste the contents below under the Kubernetes Pod Logs section in the pipeline.
This code includes a fully fleshed out
loki.writecomponent using credentials from a Kubernetes secret and a partialloki.source.kubernetescomponent.loki.source.kubernetes "pods" {
// TODO: Target the k8s pods
// TODO: Forward to Grafana Cloud Logs
}
loki.write "grafana_cloud" {
endpoint {
url = convert.nonsensitive(remote.kubernetes.secret.creds.data["logs_url"]) + "/loki/api/v1/push"
basic_auth {
username = convert.nonsensitive(remote.kubernetes.secret.creds.data["logs_user"])
password = remote.kubernetes.secret.creds.data["access_token"]
}
}
} -
In the
loki.writecomponent, configure the target to use the output of our relabeled pods from the previous section. (Hint: this is probably just like what we did for metrics)See the solution
targets = discovery.relabel.k8s_pods.output -
In the
loki.writecomponent, configure forwarding to the receiver ofloki.write.grafana_cloud.See the solution
forward_to = [loki.write.grafana_cloud.receiver] -
Click the Test configuration pipeline button to validate the config.
-
Click the Save button to apply it.
-
In the modal that pops up warning that your pipeline is active, click Save again.
Check your work
With logs being collected now, let's confirm we're ingesting them.
-
Open the browser tab for the Grafana Alloy UI and click Remote Configuration in the top navigation.
-
Click the View button next to the lab_scrape_telemetry.default pipeline.
-
Click the blue Graph button just below the name of the pipeline on the details page.
-
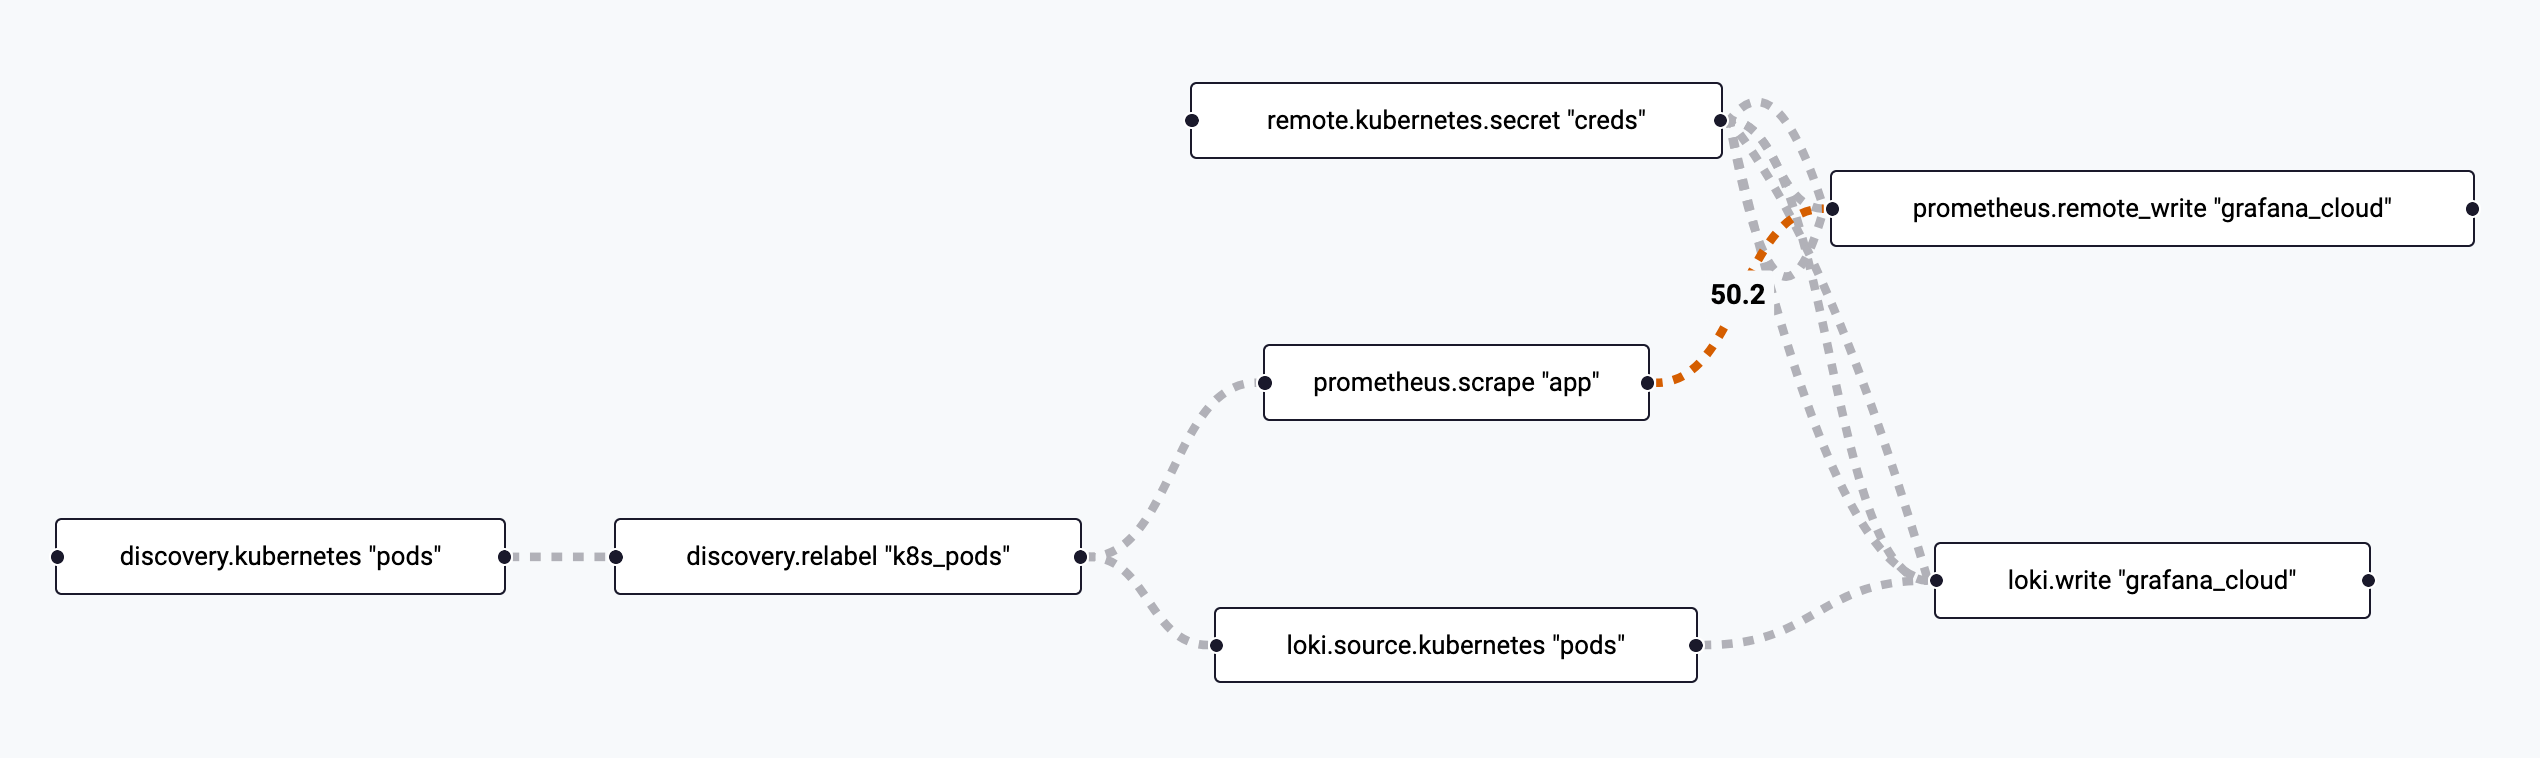
Verify you see the boxes for the newly added Loki components.
-
While we can verify the targets for the
loki.writecomponent, it does not support live debugging in the UI.From the Grafana UI, navigate to Drilldown > Logs and look for entries for services like
public-api,catalog, andcopy.
Wrapping Up
In this lab, you learned how to:
- Configure Fleet Management pipelines
- Configure Kubernetes service discovery
- Use the Alloy UI
- Scrape Prometheus metrics
- Collect Kubernetes pod logs
Click Next to continue to the next module.