1.3. Push-based Telemetry
Now that we've collected half of our signals using pull-based methods, we'll focus on configuring Alloy to receive traces and profiles from the services in our QuickPizza application.
Grafana Alloy has support numerous OpenTelemetry components. If you're already a user of the OpenTelemetry collector, you can migrate your existing configuration over to Alloy. This allows you to easily keep your existing transformations, filters, etc.
Step 1: Receive Traces
Our QuickPizza application is already instrumented with the OpenTelemetry SDK and is configured to send traces to Alloy via OTLP. Now we need to configure our Alloy instance to receive those traces and forward them to Grafana Cloud.
These Grafana Alloy docs may prove useful:
- otelcol.receiver.otlp component reference
- otelcol.processor.batch component reference
-
Navigate to Connections -> Collector -> Fleet Management in the left-hand menu.
-
You will land on the Inventory page, where you will see the Alloy instance assigned to you.
Click the Remote Configuration tab to list the pipelines we have configured.
-
Click the Edit (pencil icon) button next to the lab_receive_telemetry pipeline to open the partially built pipeline we'll be modifying.
-
In the
otelcol.receiver.otlpcomponent, configure the HTTP and GRPC receivers to listen on default addresses/ports.See the solution
  http { }
grpc { } -
In the
otelcol.receiver.otlpcomponent, set the output to the receiver of theotelcol.processor.batchcomponent.See the solution
  output {
    traces = [otelcol.processor.batch.default.input]
} -
In the
otelcol.processor.batchcomponent, set the timeout to2s. This helps reduce the numher of requests to Grafana Cloud and stay within our request rate limits.See the solution
timeout = "2s" -
In the
otelcol.processor.batchcomponent, set the output to the receiver of theotelcol.exporter.otlpcomponent.See the solution
traces = [otelcol.exporter.otlp.grafanacloud.input] -
Click the Test configuration pipeline button to validate the config.
-
Click the Next button to move to the next step.
-
No changes are needed to the assigned attributes, so click the Save button.
-
From the Remote configuration screen, click the toggle icon under Active for the lab_receive_telemetry pipeline.
-
In the modal that pops up, click the Activate button.
Check your work
Now that we have profiles being ingested, let's check the Alloy UI to see what it found.
-
Open the browser tab for the Grafana Alloy UI and click Remote Configuration in the top navigation.
-
Click the View button next to the lab_receive_telemetry.default pipeline.
-
Click the blue Graph button just below the name of the pipeline on the details page.
-
Verify you see blocks for the
otelcol.receiver.otlp,otelcol.processor.batch, andotelcol.exporter.otlpcomponents.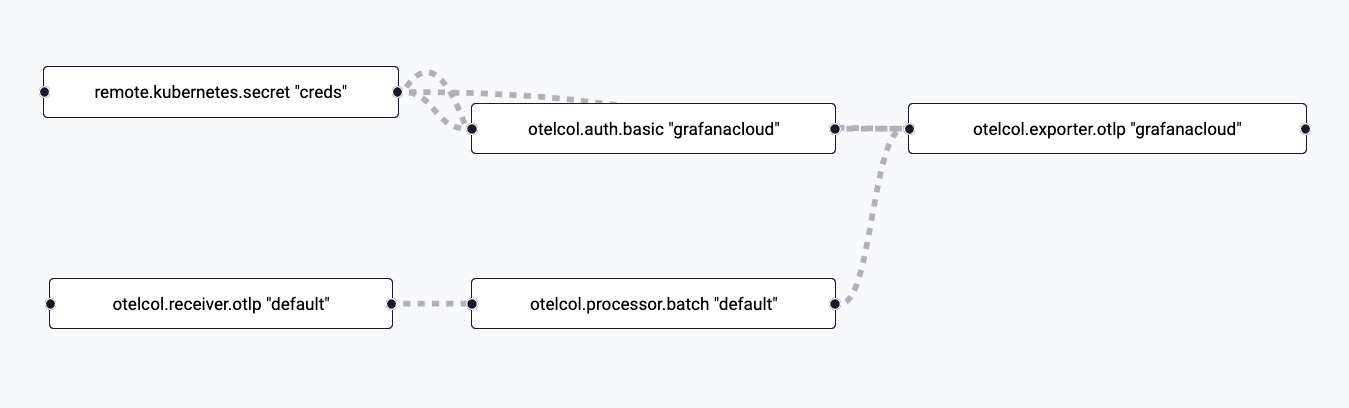
-
Click the block for the
discovery.relabelcomponent. -
Click the Exports link in the left navigation.
-
Review the outputted targets and confirm you see the labels we added such as pod, container, and service_name.
Step 2: Collecting Profiles
For our final signal, we'll configure Alloy to receive profiles. Alloy can also be configured to scrape applications for pprof profiles via HTTP or use alternative mechanisms such as eBPF. In this workshop, we have our QuickPizza application instrumented to send profiles to Alloy.
These Grafana Alloy docs may prove useful for scraping profiles:
- pyroscope.receive_http component reference
- pyroscope.write exported fields
-
Return to the fleet pipeline you were working with in the previous step.
-
Paste the contents below under the Profiles section in the pipeline.
This code includes a fully fleshed out
pyroscope.writecomponent using credentials from a Kubernetes secret and a partialpyroscope.receive_httpcomponent.pyroscope.receive_http "receiver" {
// TODO: Configure the HTTP listener for port 4040
// TODO: Configure forwarding to the receiver
}
pyroscope.write "grafana_cloud" {
endpoint {
url = convert.nonsensitive(remote.kubernetes.secret.creds.data["profiles_url"])
basic_auth {
username = convert.nonsensitive(remote.kubernetes.secret.creds.data["profiles_user"])
password = remote.kubernetes.secret.creds.data["access_token"]
}
}
} -
In the
pyroscope.receive_httpcomponent, configure the HTTP receiver to listen on port 4040.See the solution
  http {
    listen_port = 4040
} -
In the
pyroscope.receive_httpcomponent, configure forwarding to the receiver ofpyroscope.write.grafana_cloud.See the solution
forward_to = [pyroscope.write.grafana_cloud.receiver] -
Click the Test configuration pipeline button to validate the config.
-
Click the Save button to apply it.
-
In the modal that pops up warning that your pipeline is active, click Save again.
Check your work
Now that we have profiles being ingested, let's check the Alloy UI to see what it found.
-
Open the browser tab for the Grafana Alloy UI and click Remote Configuration in the top navigation.
-
Click the View button next to the lab_receive_telemetry.default pipeline.
-
Click the blue Graph button just below the name of the pipeline on the details page.
-
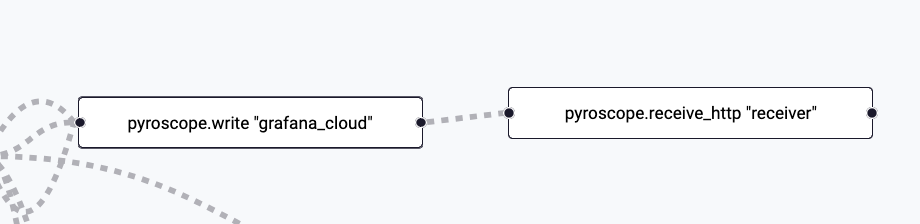
Verify you see the blocks for the newly added Pyroscope components.
-
To confirm we've received data, we will navigate to Drilldown > Profiles and look for entries for services like
public-api,catalog, andcopy.
Wrapping Up
In this lab, you learned how to:
- Configure the OTLP receiver for traces
- Configure the batch processor
- Configure the Pyroscope receiver and writer
- Use Drilldown in Grafana Cloud
Click Next to continue to the next module.