1.1. Exploring logs
View logs from a service
The Logs Drilldown app in Grafana provides an easy way to browse, search and filter Loki logs. When you're using the app, you can quickly find the logs you need without having to write a query.
In this lab, we'll look at some essential features of Logs Drilldown that help you find the logs you need, quickly. Some users have been reporting missing favicons on their websites, so let's see if we can find out why.
-
From the left menu, expand the Drilldown menu item and click on Drilldown -> Logs.
The Logs Drilldown app opens with the service list. This list is populated with all the services that are sending logs to Loki, grouped by the label
service_name. This helps you to quickly find the service you want to investigate.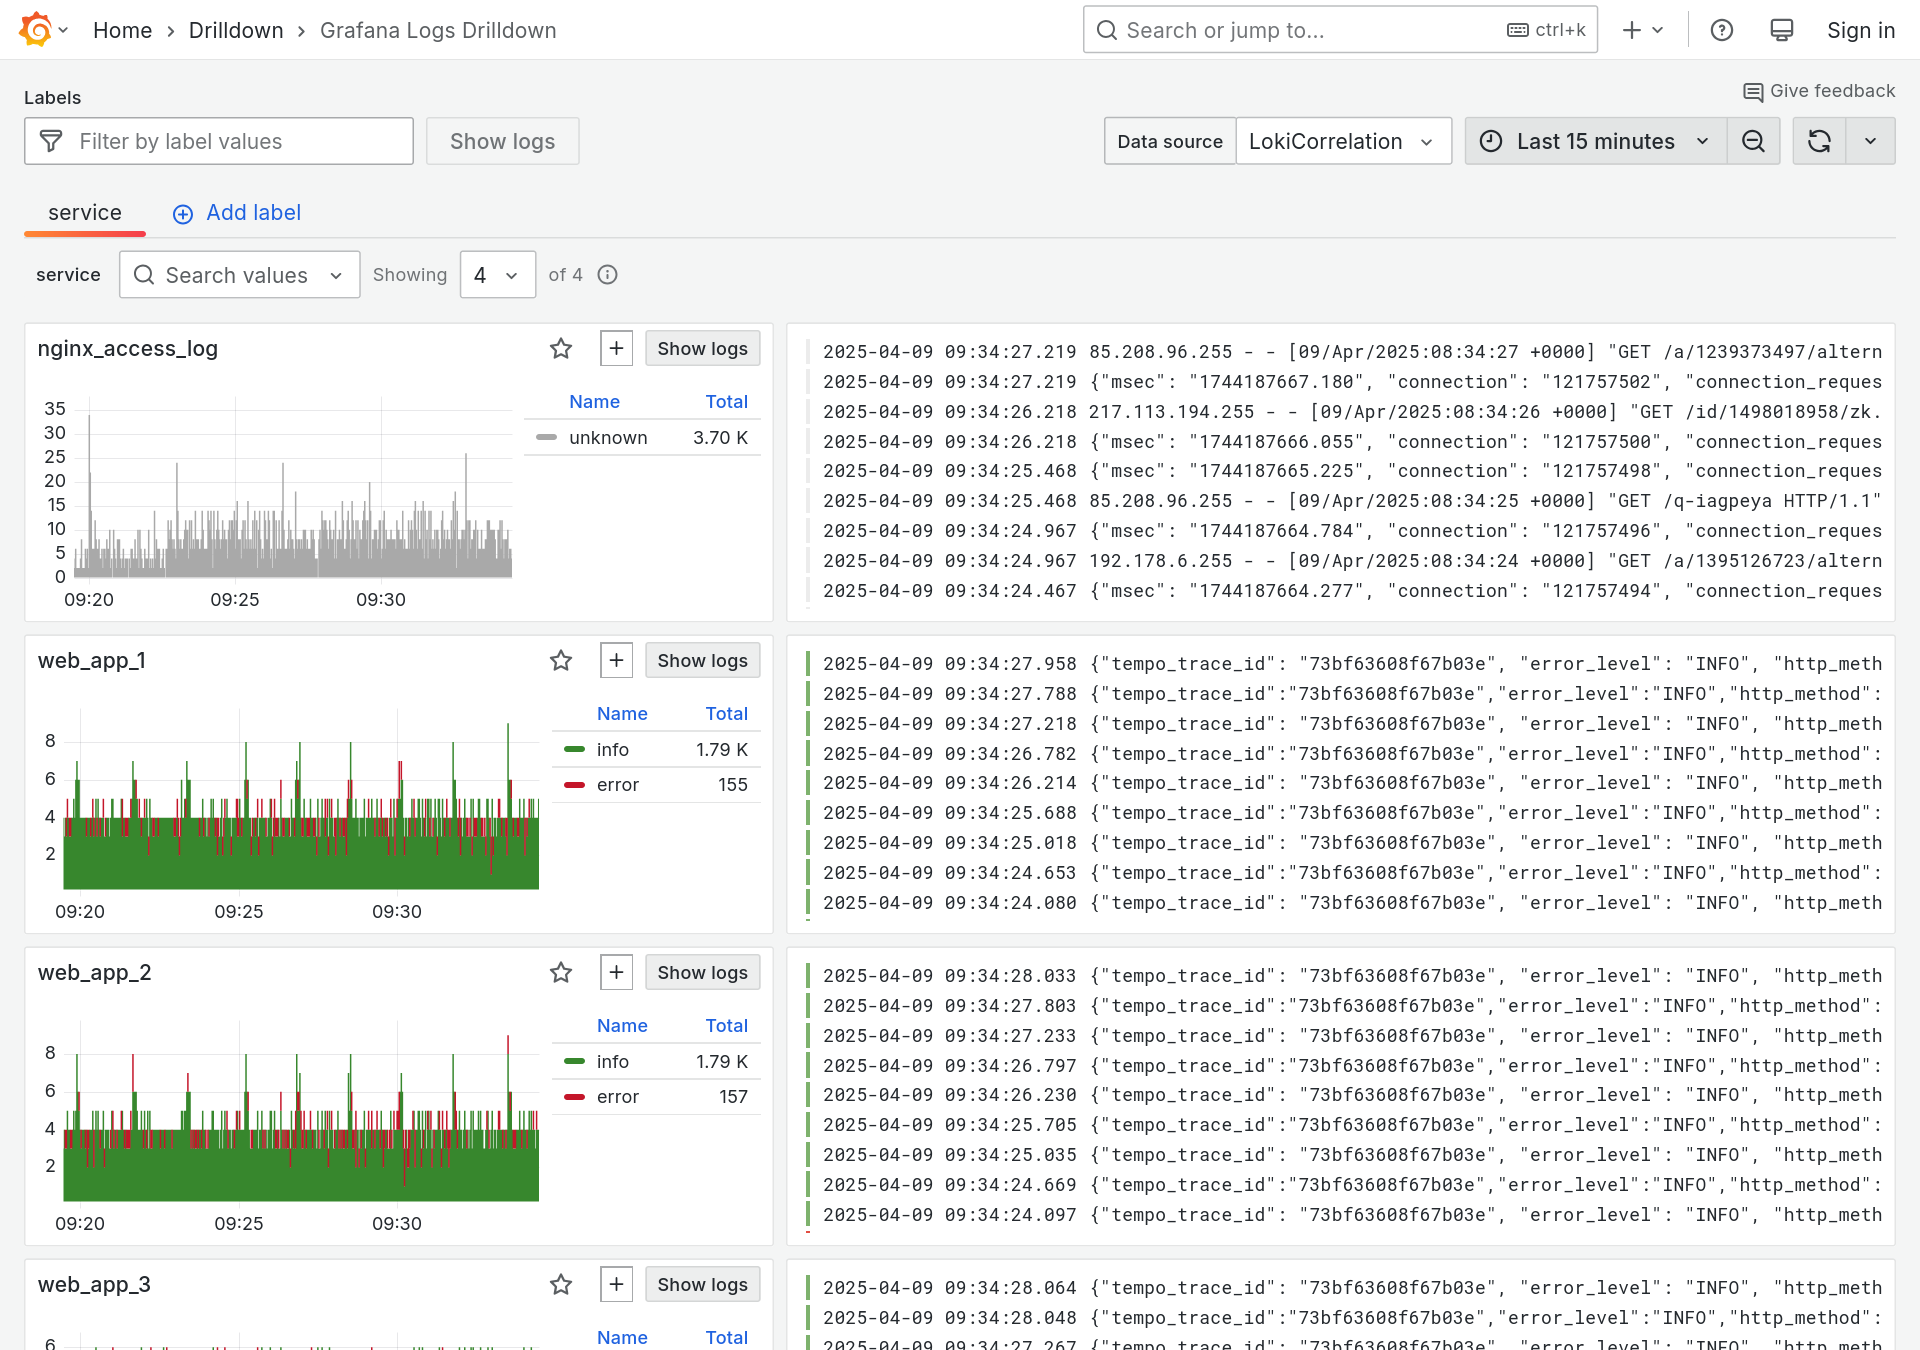 info
infoIf you can't see any logs, then ensure you have the LokiCorrelation data source selected in the top right corner of the screen.
-
Scroll down to the
web_app_3service and click the Show logs button to open the logs for this service.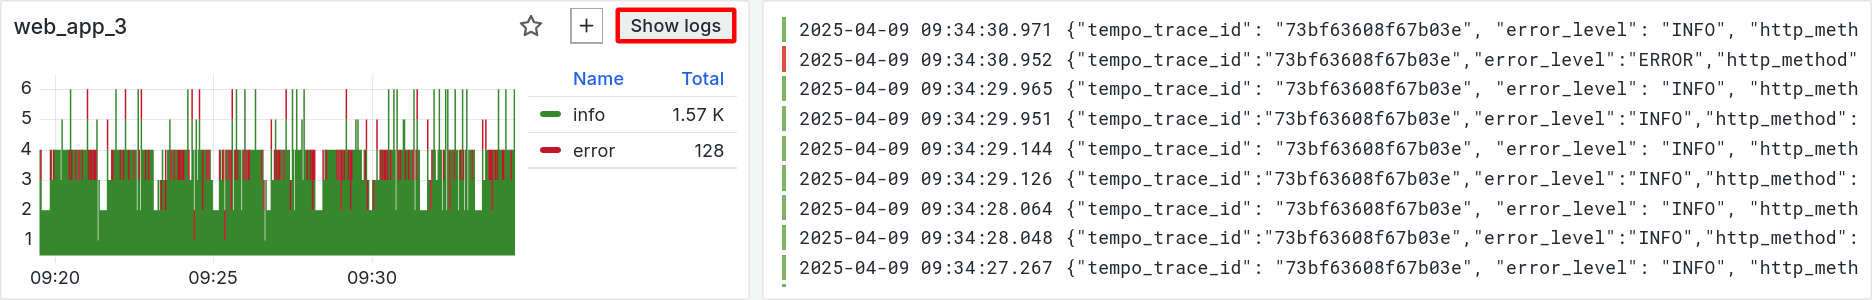
-
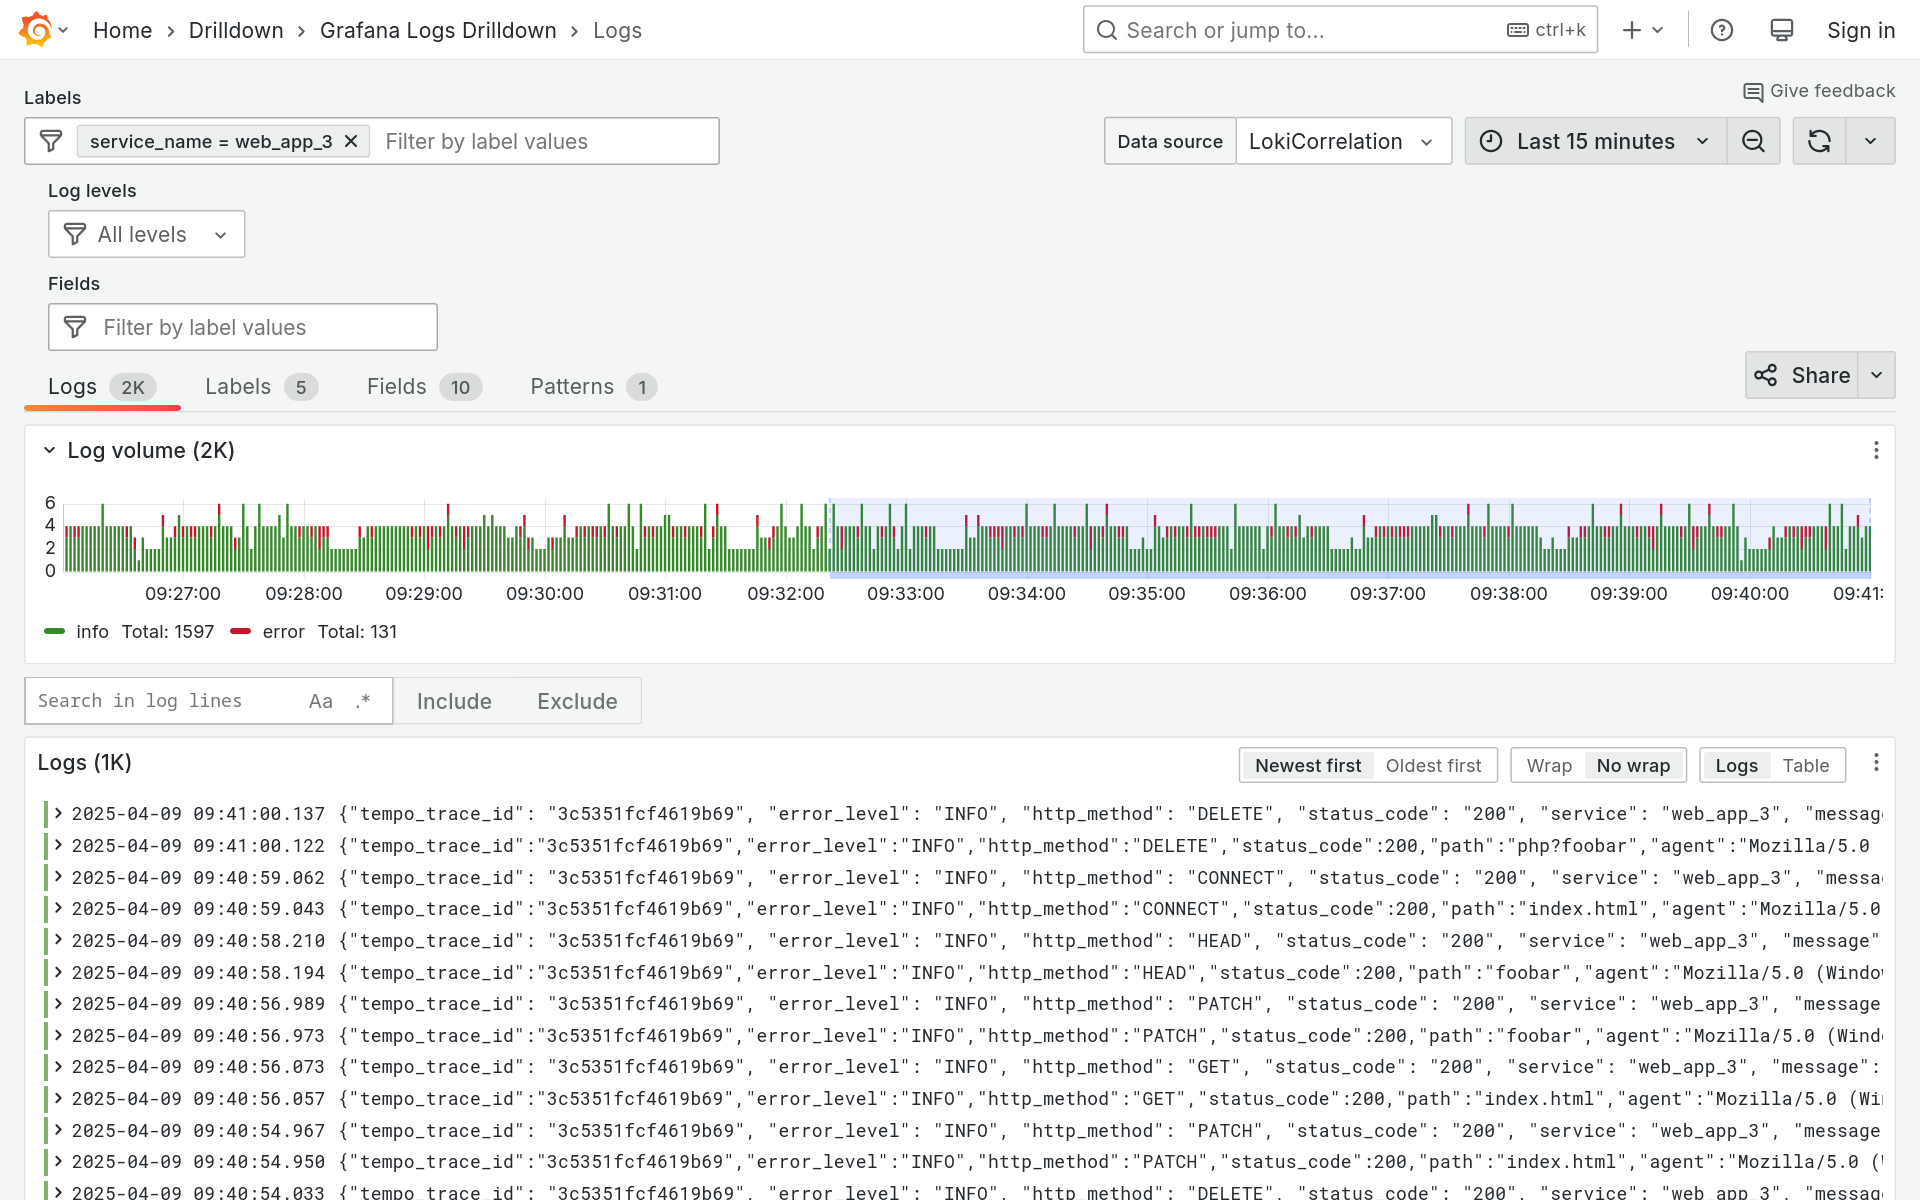
Now we see the most recent logs for our app web_app_3. This view shows us:
-
A chart showing the volume of logs received for this service over time
-
A list of log lines for this service
-
The time period for search, shown in the top right
 tip
tipIf the log lines are too long for your browser, you can scroll horizontally, or click the Wrap button to enable line wrapping.
-
Understanding a log line in Loki
-
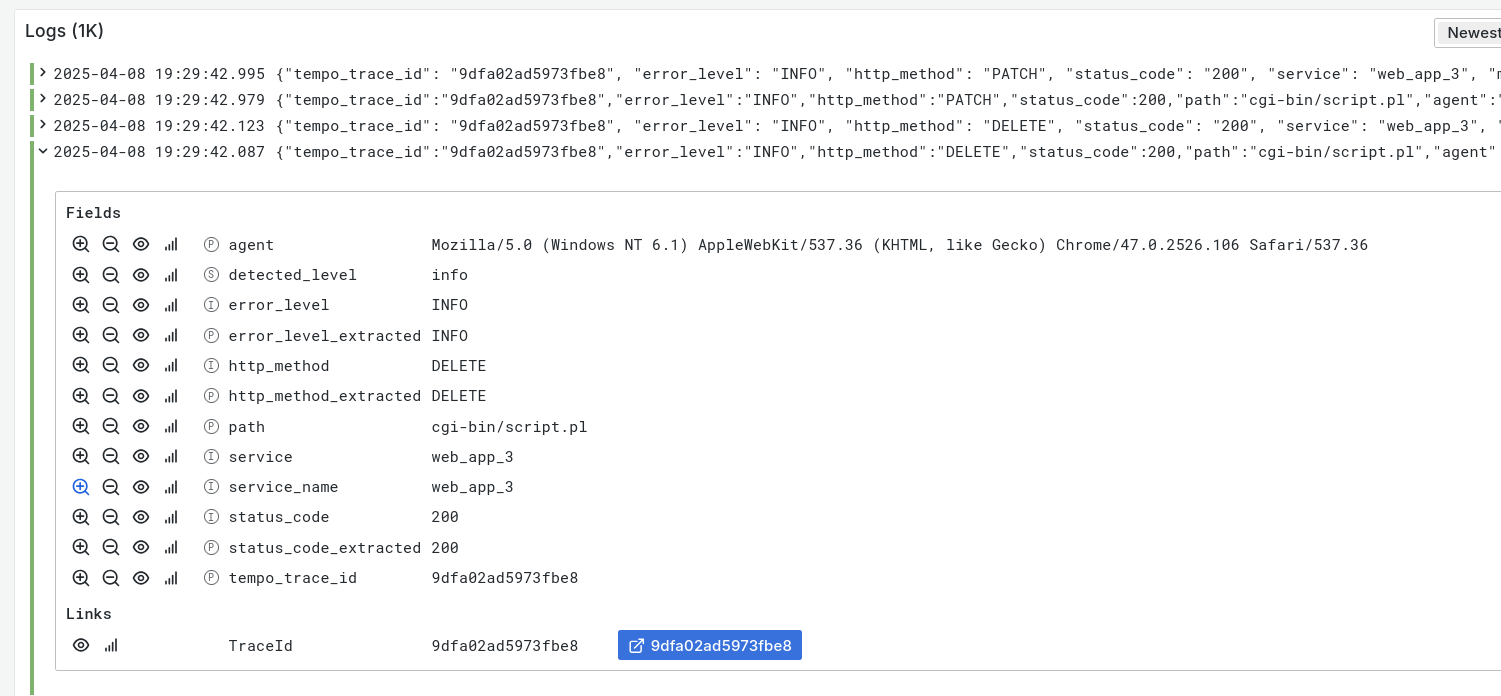
While viewing the logs for web_app_3, click on one of the returned log lines to expand it.
-
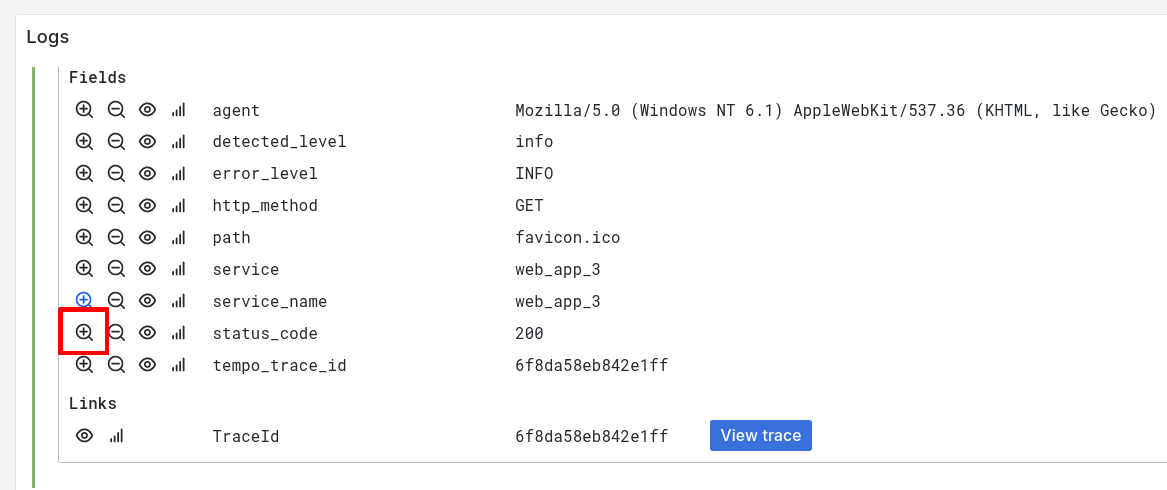
When you expand a log line, the detail view shows the Fields that are associated with it:
-
Indexed labels which locate the log line in Loki's index (denoted by I)
-
Parsed labels which are fields inside the log line itself, that Loki has parsed at query time (denoted by P)
-
Structured metadata which are un-indexed key-value pairs attached to a log line (denoted by S)
The fields are displayed in a table, with icons that allow you to filter the logs by that field.
-
Searching and filtering
-
Let's troubleshoot our website by finding all the requests for the
favicon.icofile that are returning a 404 status code.In the search bar, enter the text favicon. This will show only those log lines containing the string
favicon: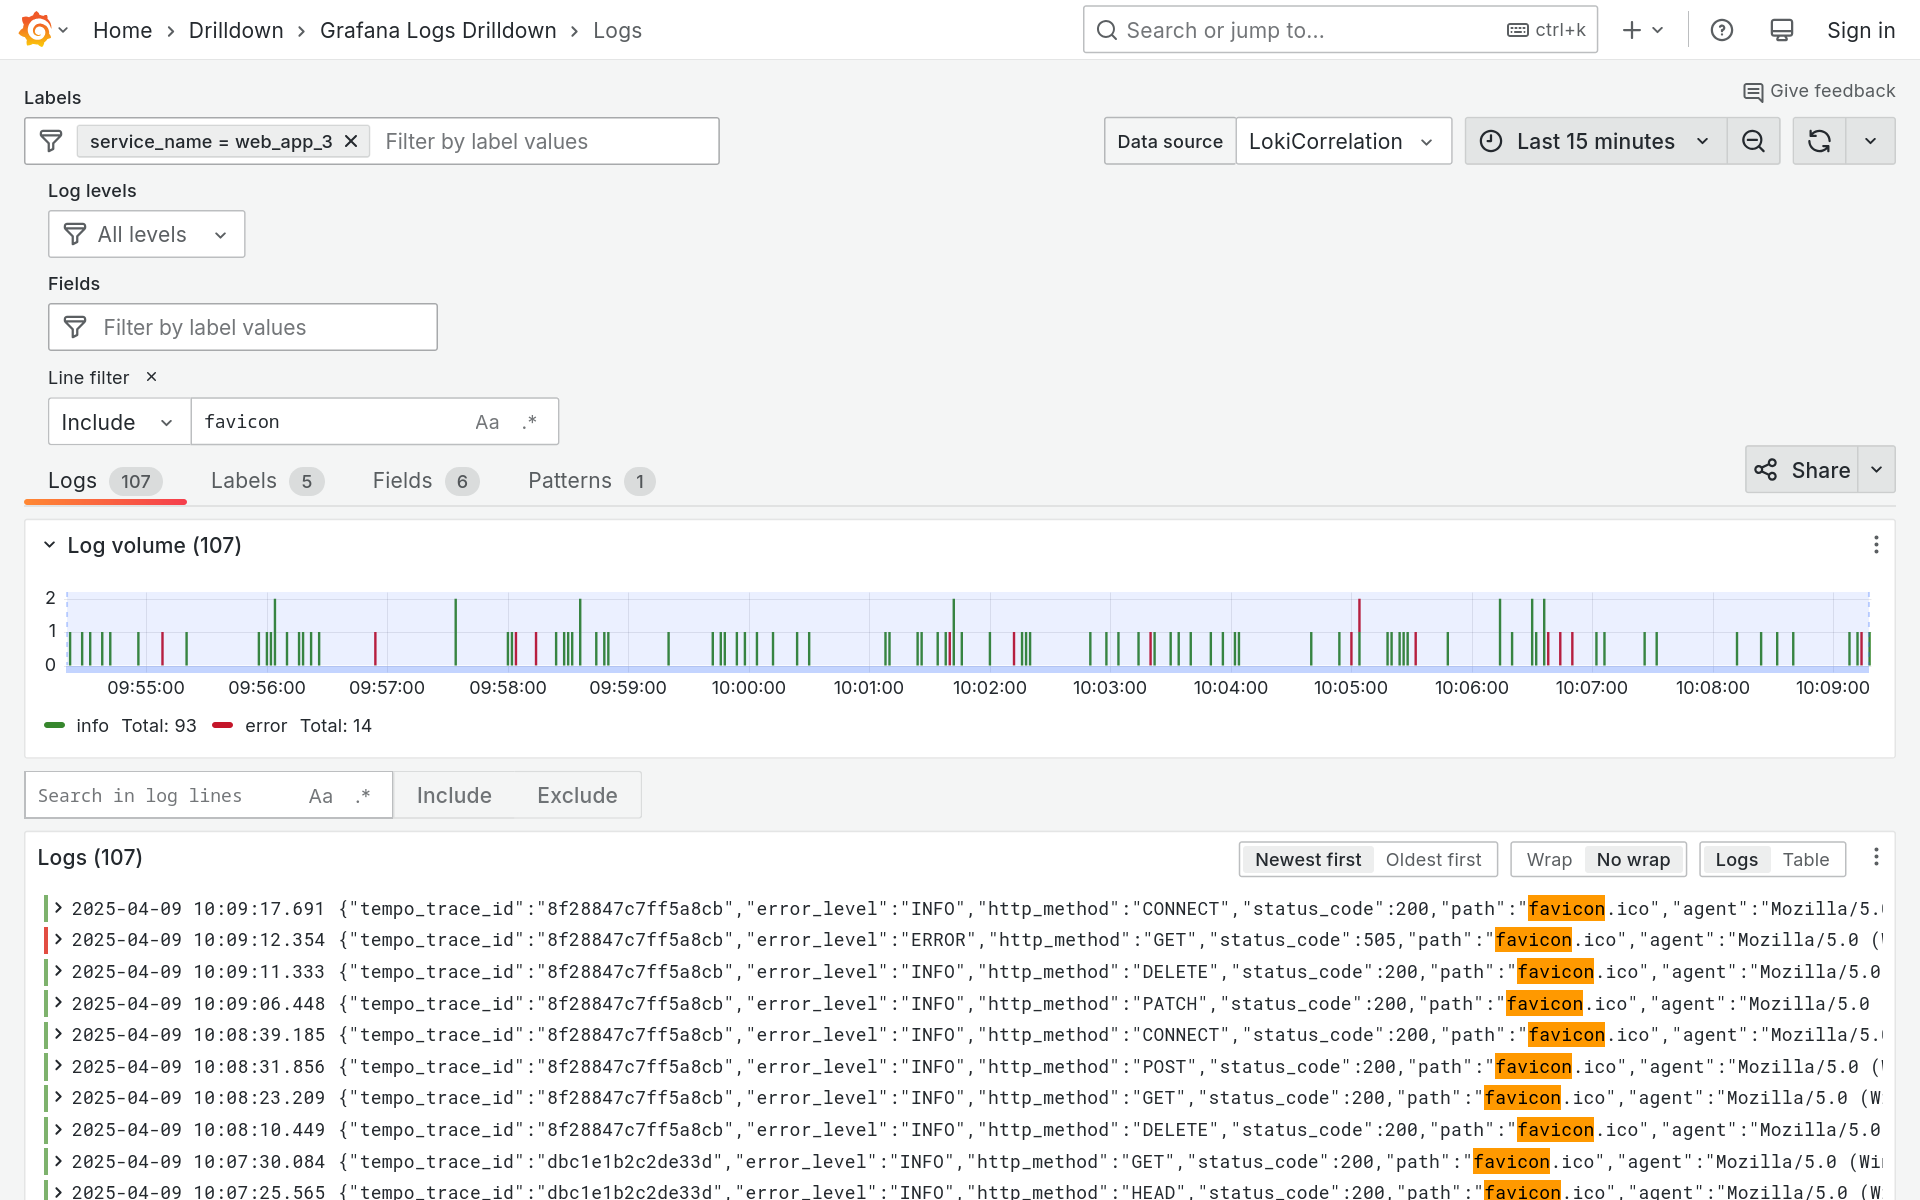
-
Let's add another filter for status_code.
Click on a log line to expand it. Then, by the side of status_code, click on the magnifying glass icon with the plus sign:
-
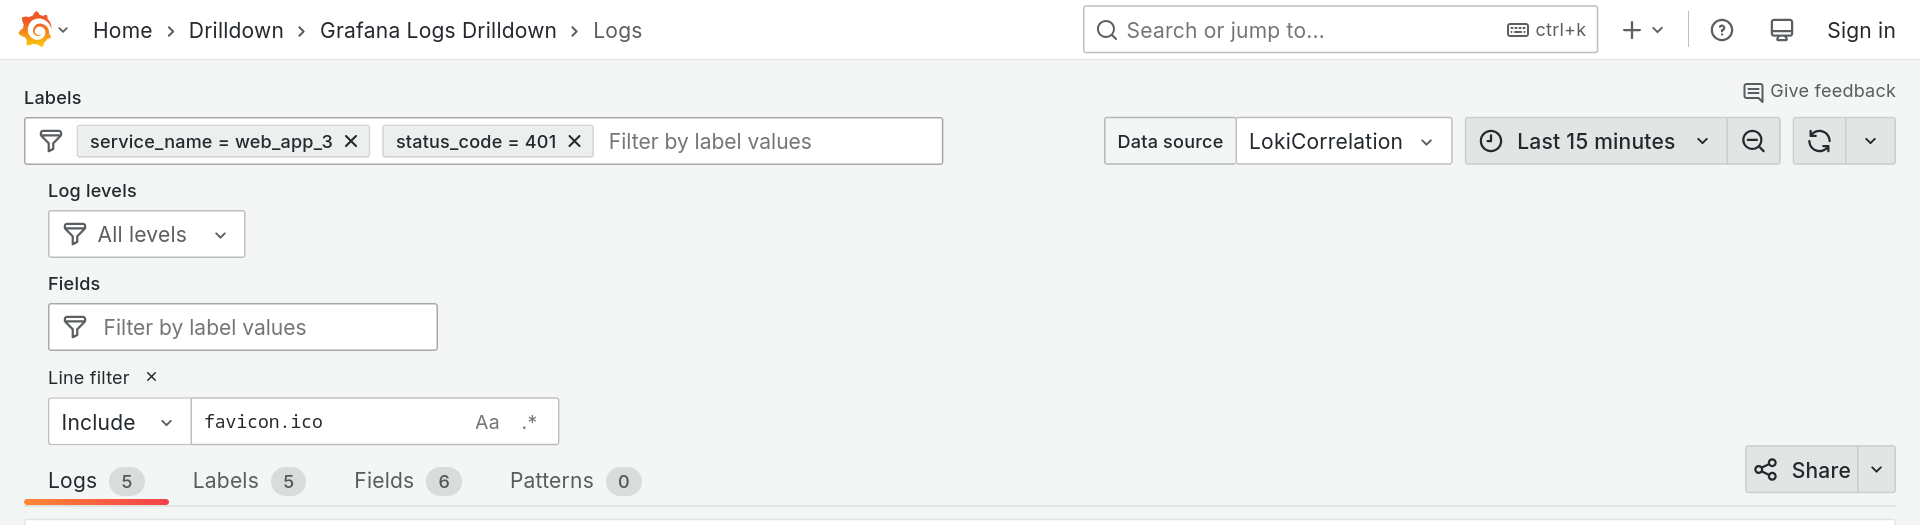
The log results are updated to show only those logs which contain the string
faviconand have thestatus_codethat you just selected.At the top of the page, we can see all of our search filters, where we can easily change or remove them:
-
Let's change our status_code filter to show only 404 responses. At the top of the screen, click on the status_code label filter and pick the 404 value from the dropdown list.
Now, only logs from the app which contain the string
favicon.icoand have the status_code 404 are shown. We're already on our way to solving the mystery of the missing favicon!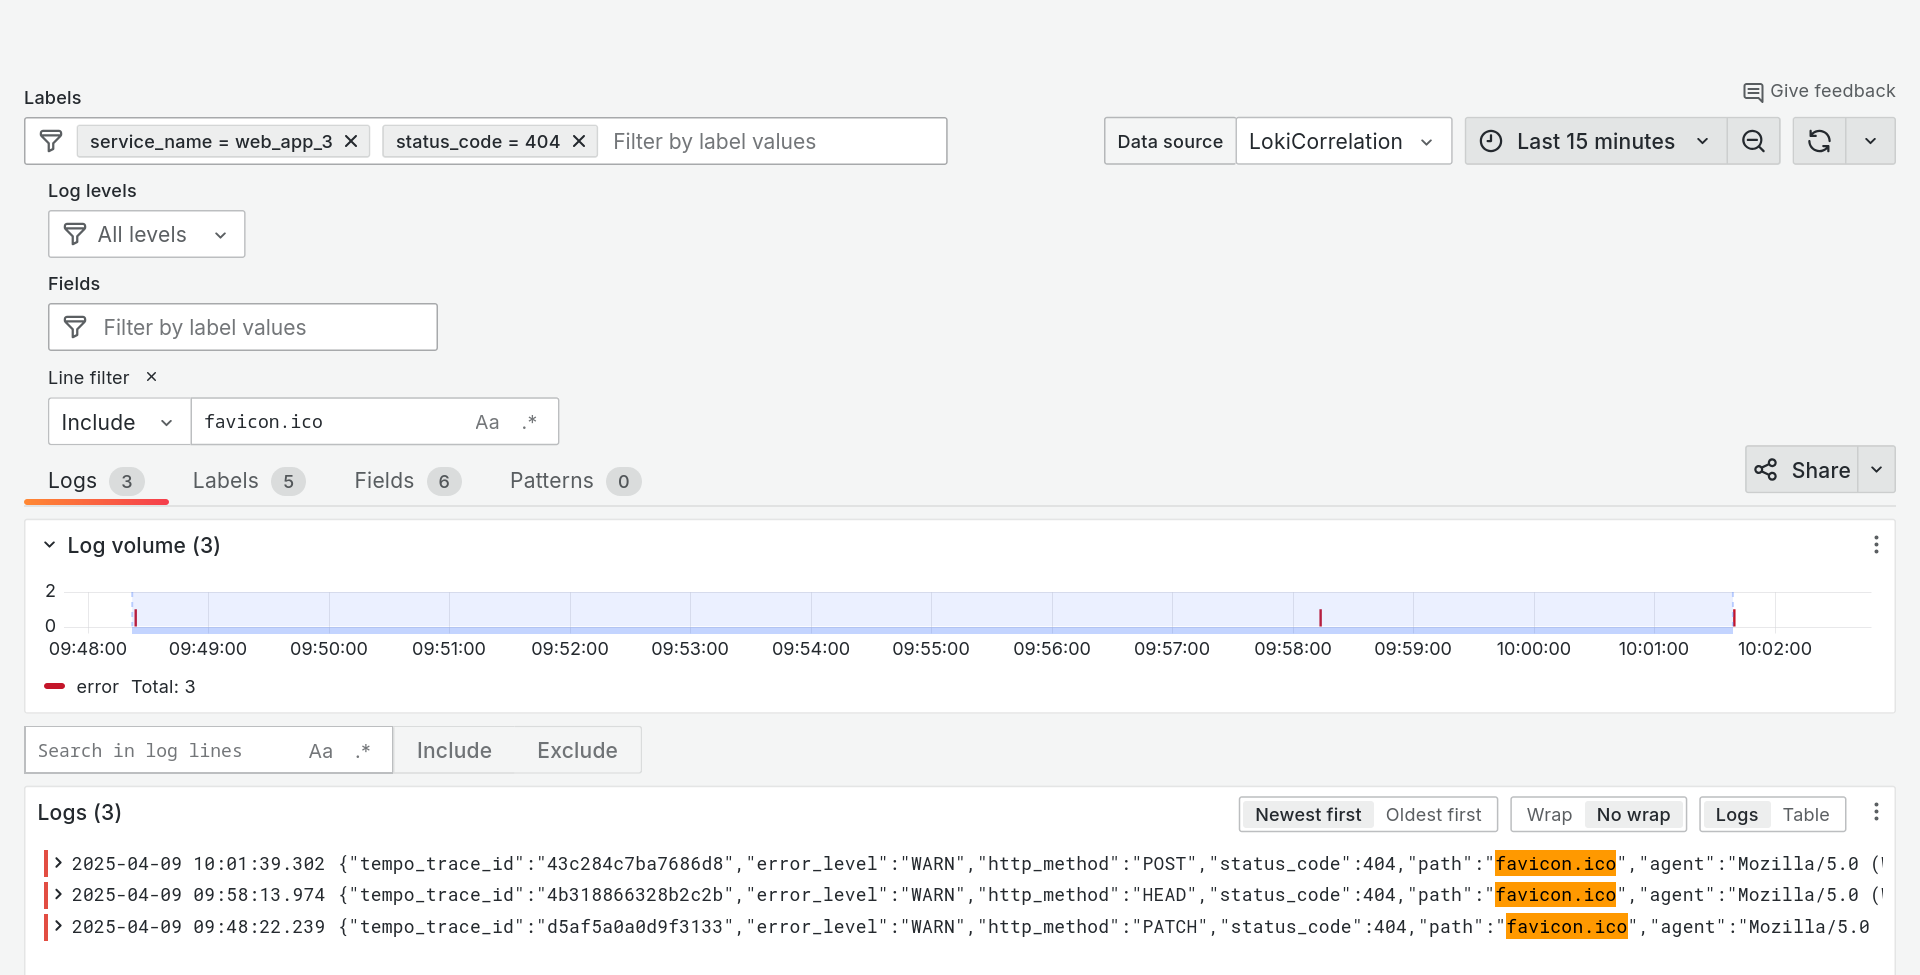
View metrics from logs
Logs Drilldown also lets you deeply understand the shape and content of your logs, through instant metrics and charts.
Under the hood, Loki's metrics from logs feature instantly calculates metrics from your log lines or labels, which Logs Drilldown then visualizes as a chart.
This helps you to quickly answer very common questions, like:
- Is the number of errors in my app increasing?
- Which are the most popular routes in my app, or the most popular pages on my website?
Let's take a look at these metrics:
-
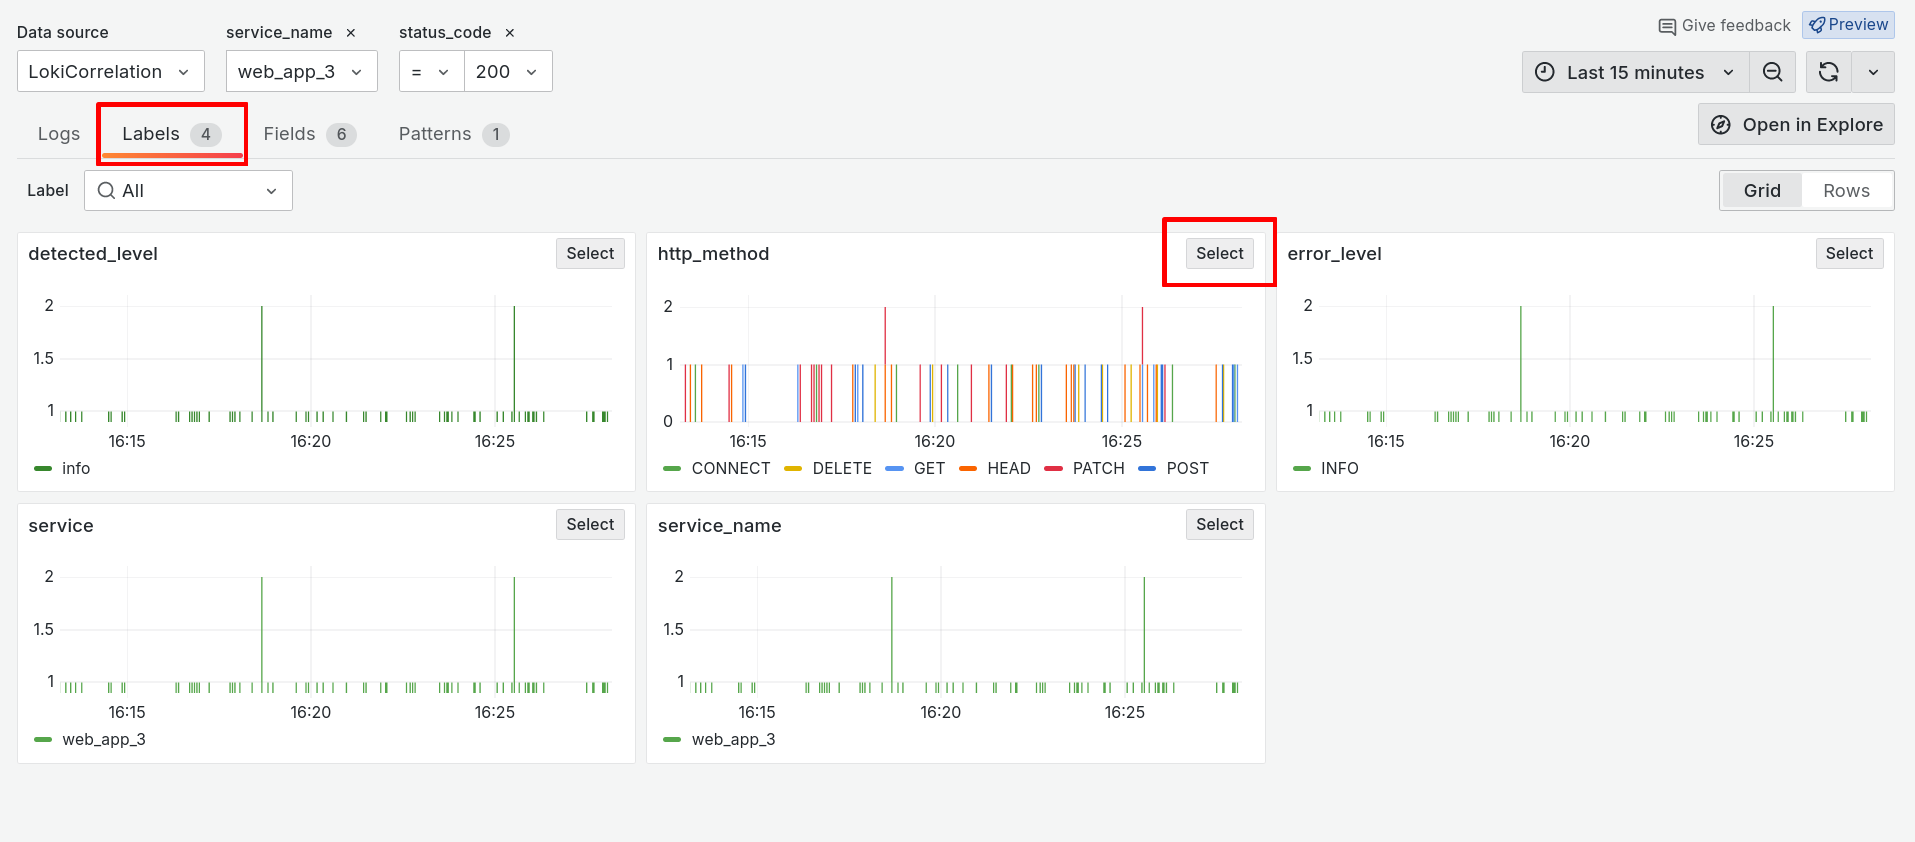
From the row of tabs above the log volume chart, click on the Labels tab.
Logs Drilldown shows a breakdown of Loki labels, charting their respective values.
In the http_method panel, click on the Select button to drill down to logs with this label:
-
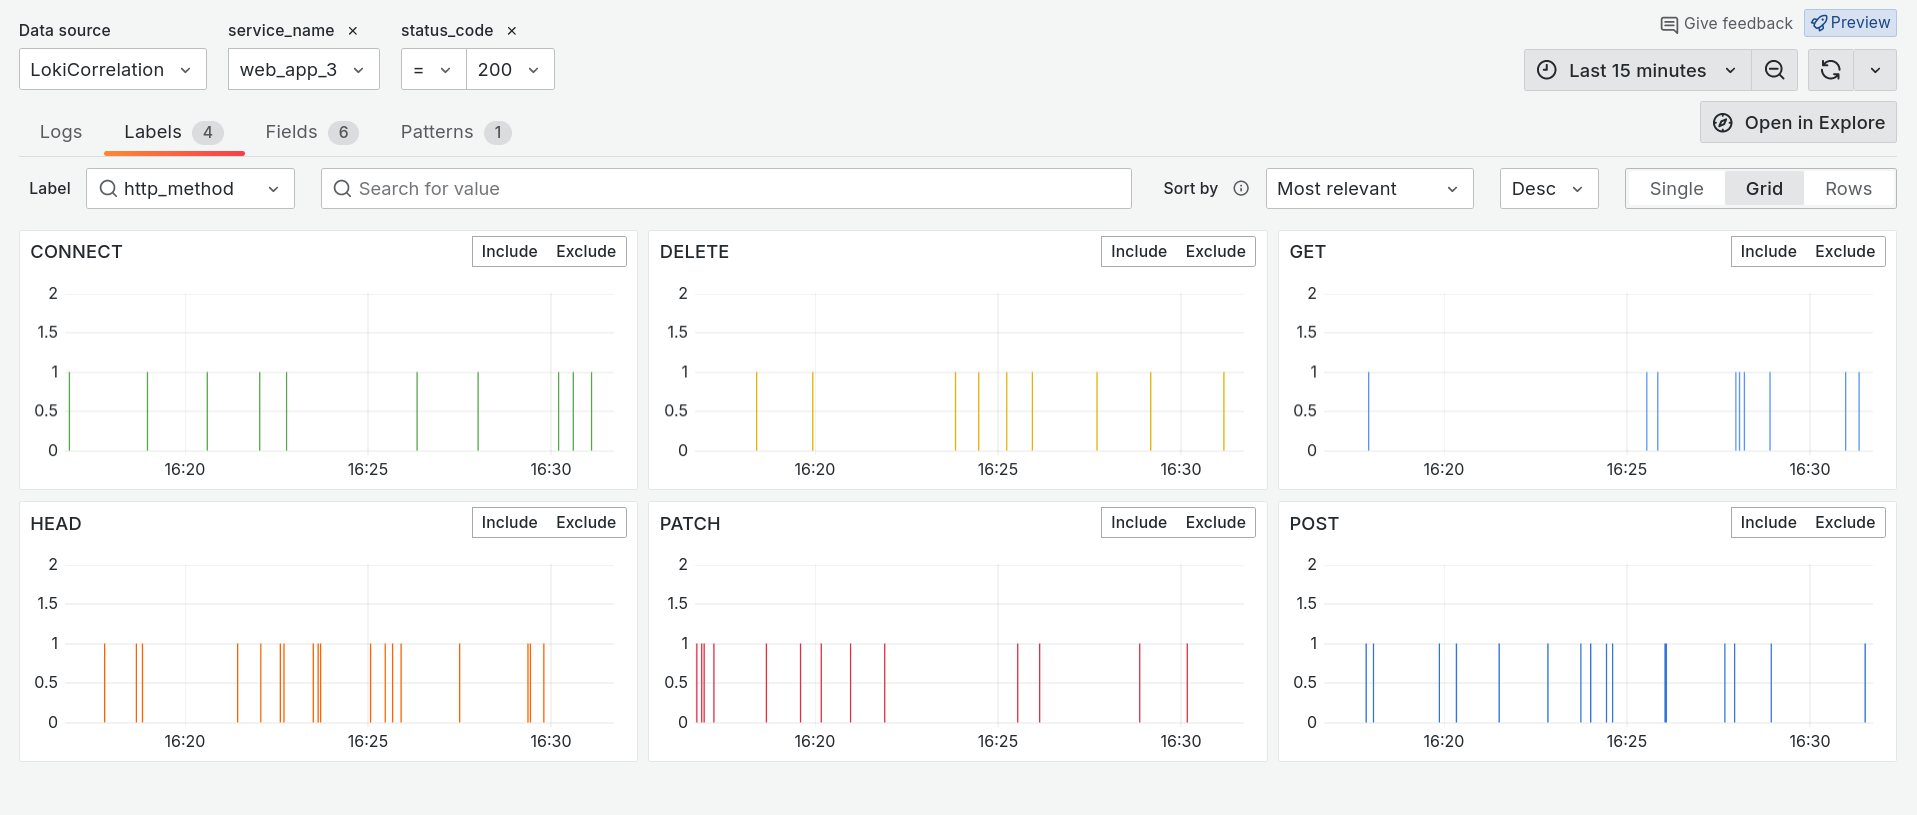
Now we can see a further breakdown of our filtered logs, broken down by the
http_methodlabel.From any panel, click on the Include button to show only logs with that label value.
-
Then click the Logs tab to return to the logs list.
Notice how the logs have been further filtered to show only those which have your selected
http_methodlabel value.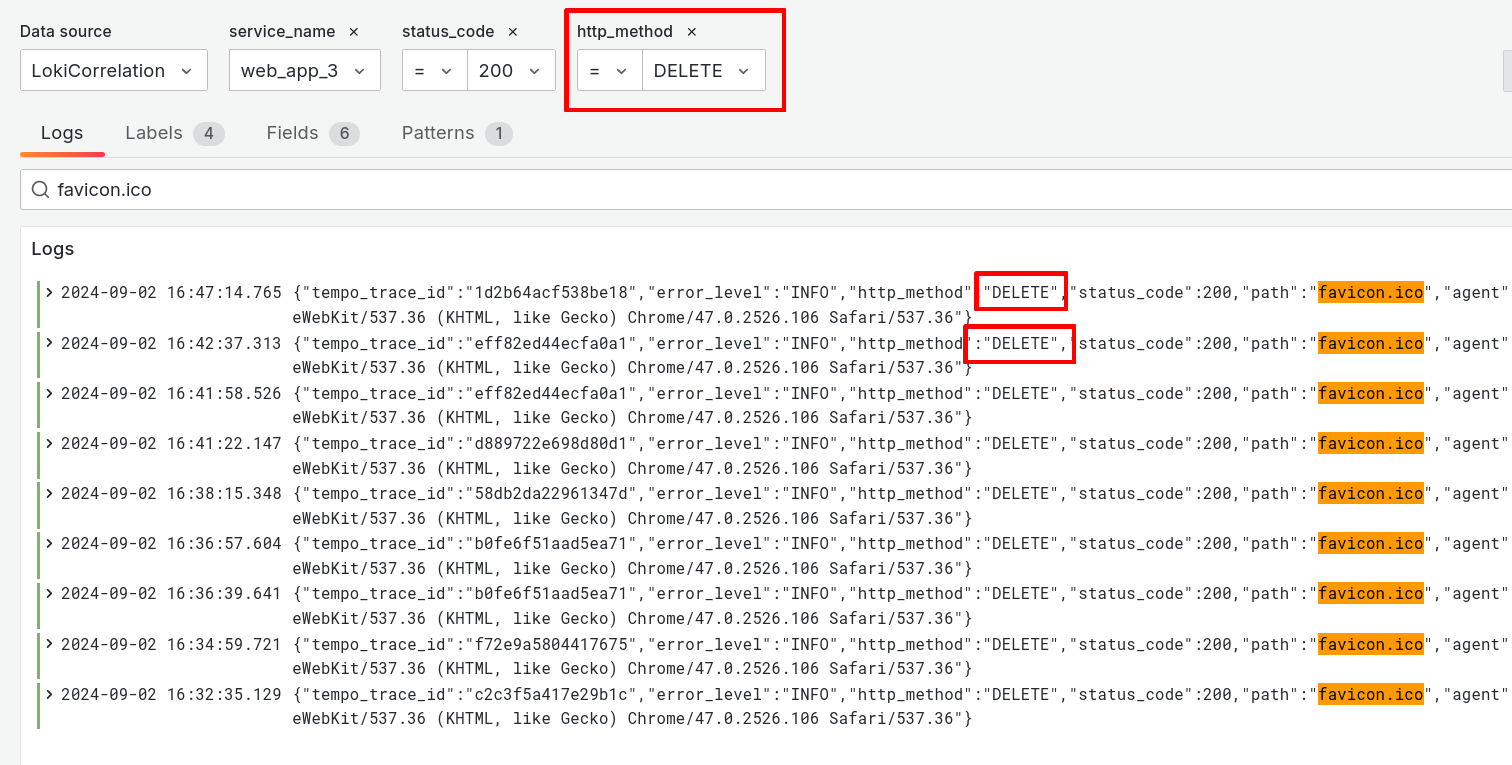
Wrapping up
Logs Drilldown is a powerful tool for diving into your logs and gaining instant insights without having to write a query.
When you want to dive further into Loki, you can start writing queries in LogQL, Loki's query language. In the next section of this lab, we will move from Logs Drilldown into writing queries for Loki.
Click Next to continue.