1.2. Query and correlate logs
Let's now dive into some Loki querying, using Loki's LogQL query syntax.
Run a Loki query and view logs in a Table
-
In the main logs panel, open the context menu (three dots, at the top right of the panel, located near the Logs / Table / JSON toggle), then click on Open in Explore.
Grafana automatically turns your Logs Drilldown session into a Grafana Explore session, filling in your LogQL query for you, so you can begin deeper analysis of the logs.
Notice how we can see:
-
The LogQL query that was being used to perform our search
-
The log volume over the current time period
infoLogQL is the query language in Loki. A basic LogQL query looks like this:
{my_label="value"} |= `foo` -
-
Modify the LogQL query to remove the
status_codeandhttp_methodlabel filters, as below. then click on Run query:{service_name=`web_app_3`} | json |~ `(?i)favicon\.ico`Label filters (
{label="value"}) are the building blocks of any LogQL query. They allow Loki to find streams of logs.This new query:
-
Finds all logs which have the label
service_nameequal toweb_app_3. -
Parses each log line to extract JSON fields.
-
Filters the logs for lines containing the string
favicon.ico
-
-
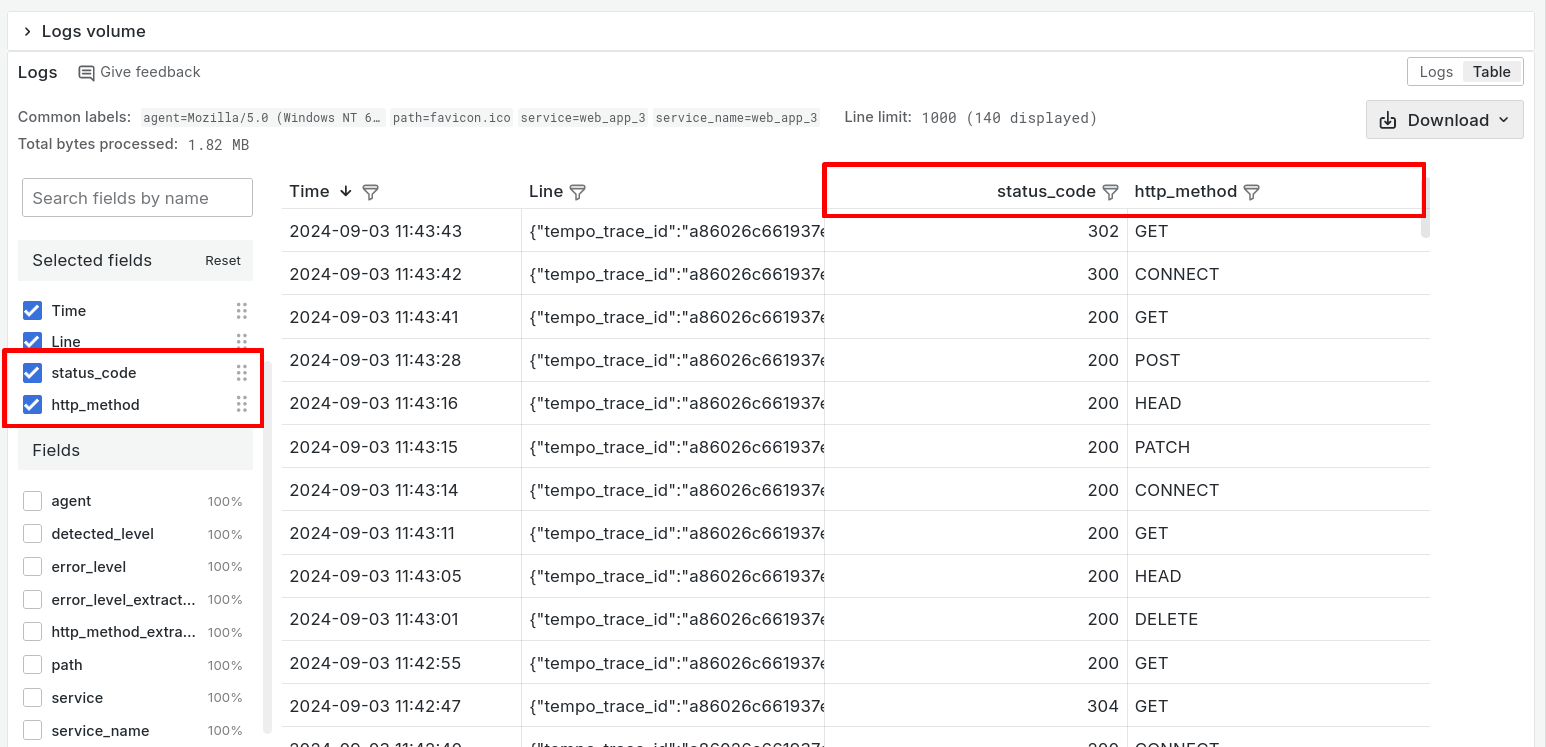
In the main Logs panel, click on the Table toggle in the right hand corner, if it is not already selected.
We can use the Table view to show logs in a tabular format, for easy scanning and analysis.
Labels, and fields that have been detected from the logs, are shown in the Fields panel on the left hand side.
-
In the Fields panel, check the boxes by status_code and http_method.
Now we can see columns for these two fields, allowing us to understand the logs more easily. The column Line shows the original log line:
 tip
tipFrom here, you can also download the logs in text, JSON or CSV formats by clicking on the Download button.
Notice how we've been able to shape and explore our data at query time, using Loki's query-time JSON parser, and without having to index the content of the logs upfront!
Correlate metrics, logs, and traces
Labels in Loki work like labels in Prometheus, allowing you to efficiently query, filter, and organize your log data. In Grafana, you can correlate logs with metrics using these labels, enabling you to view related data side-by-side, and gain deeper insights into your system's behavior and performance.
-
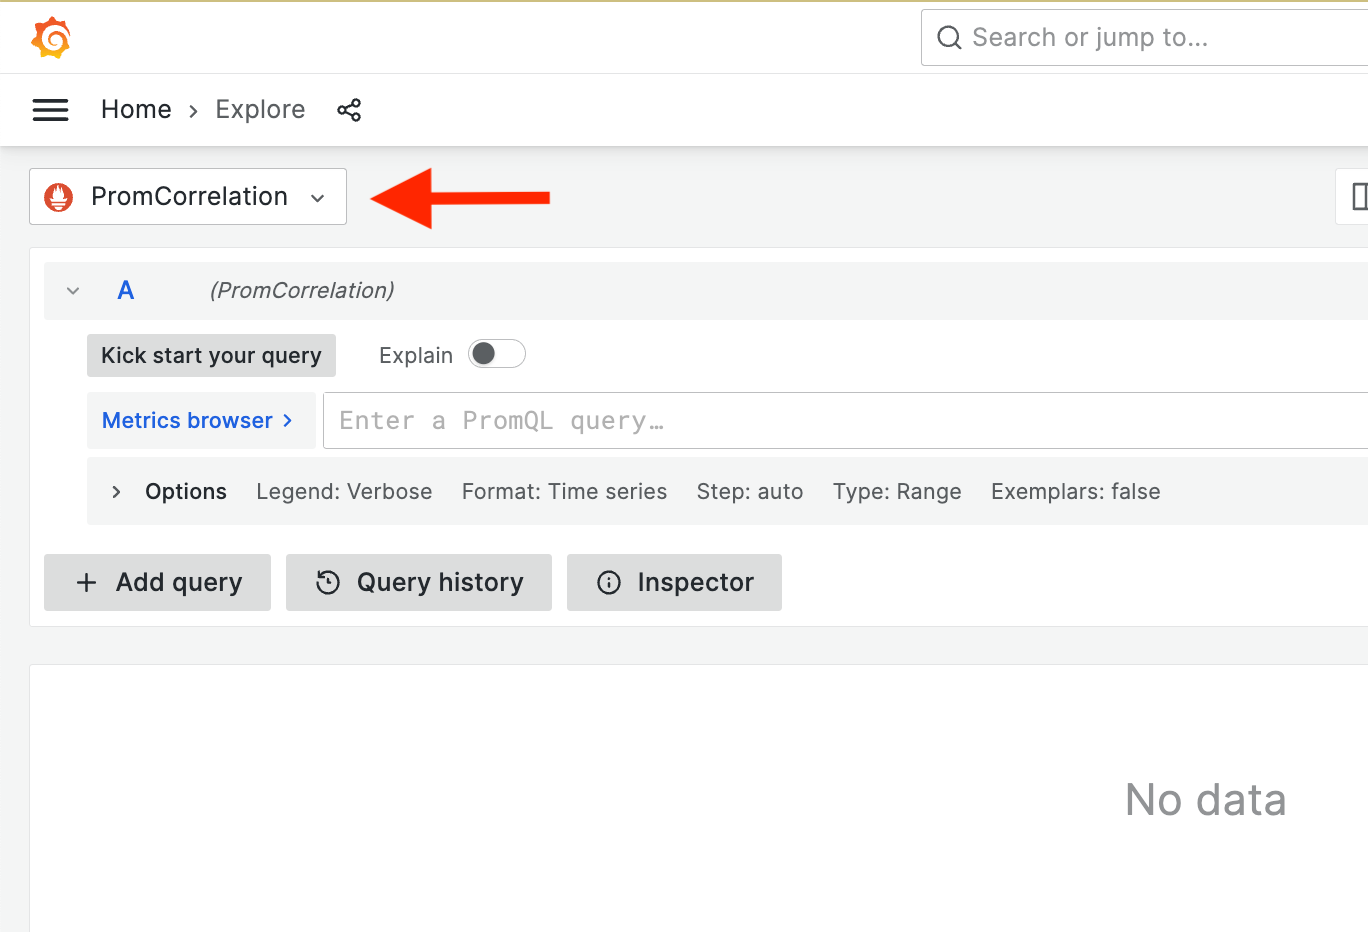
From the Grafana main menu, choose Explore and then from the data source picker, select the PromCorrelation datasource:
-
Click on the Metrics browser button. Then, from the Metrics Browser, under Select a metric, enter web and then choose web_http_requests from the list of metrics.
Then click on Use query.
-
Make sure the Time Picker (right upper corner, clock icon) is set to last 5 minutes.
Notice the three series. Each series charts the number of concurrent users over time.
-
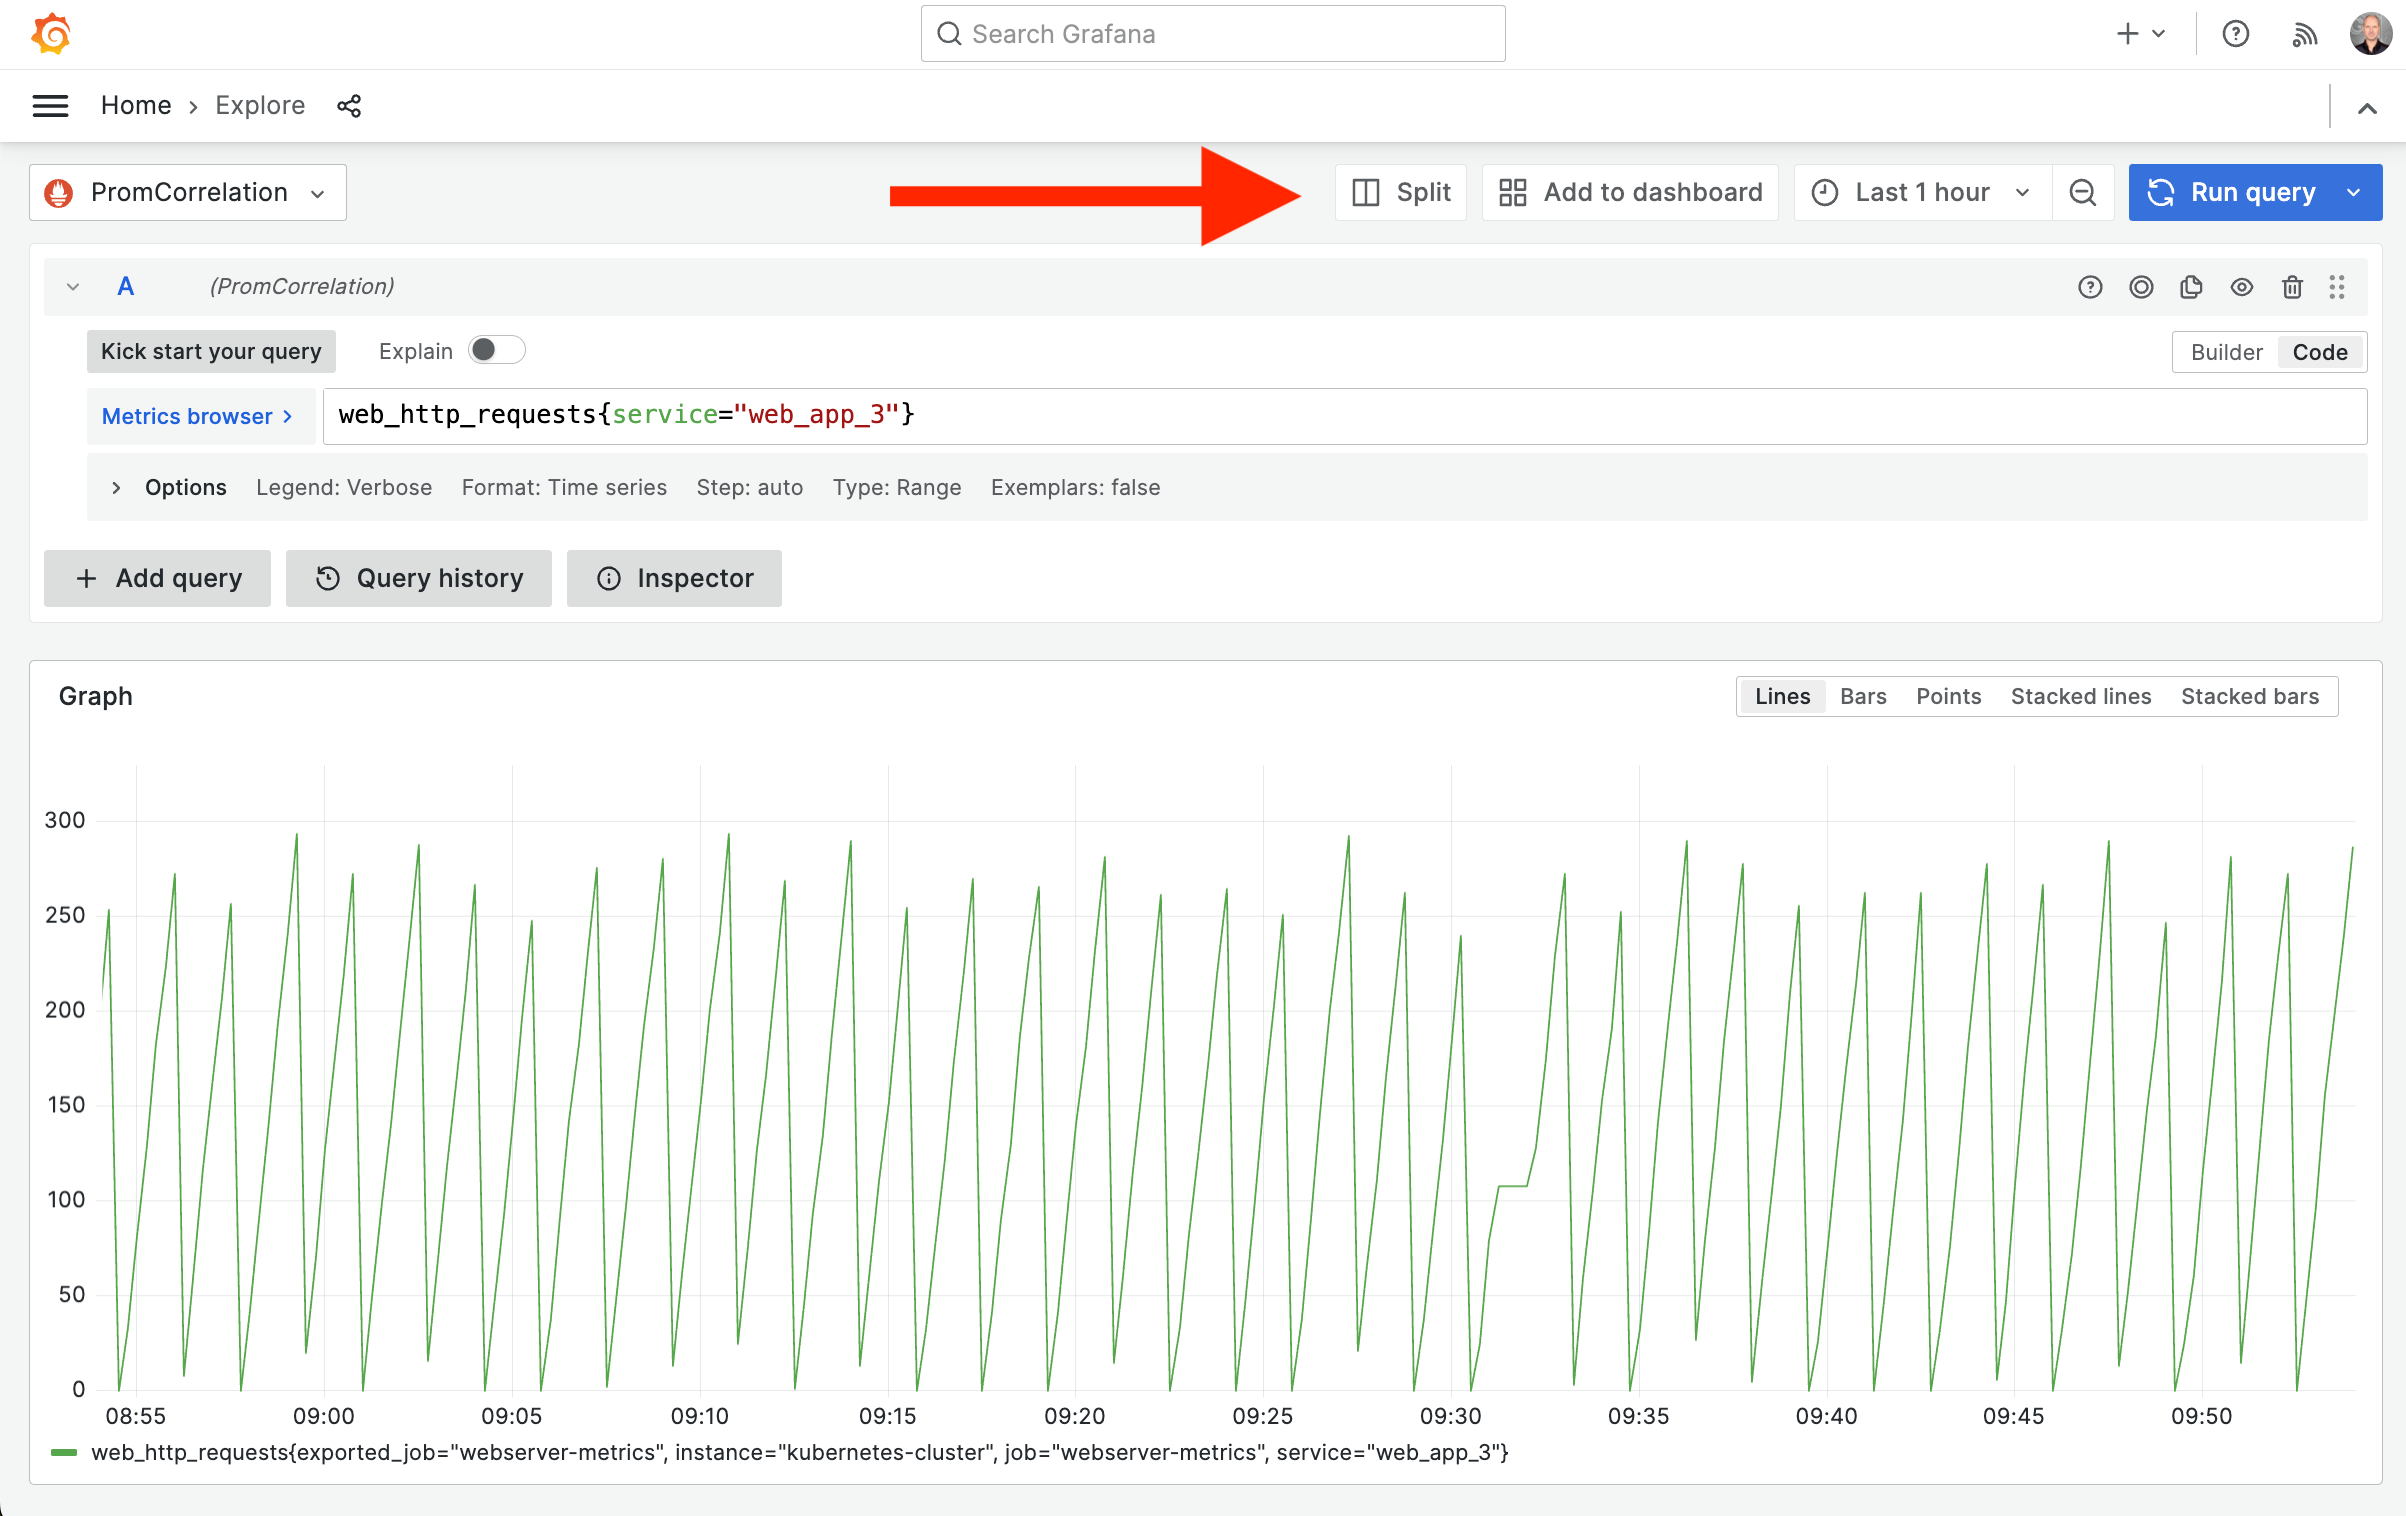
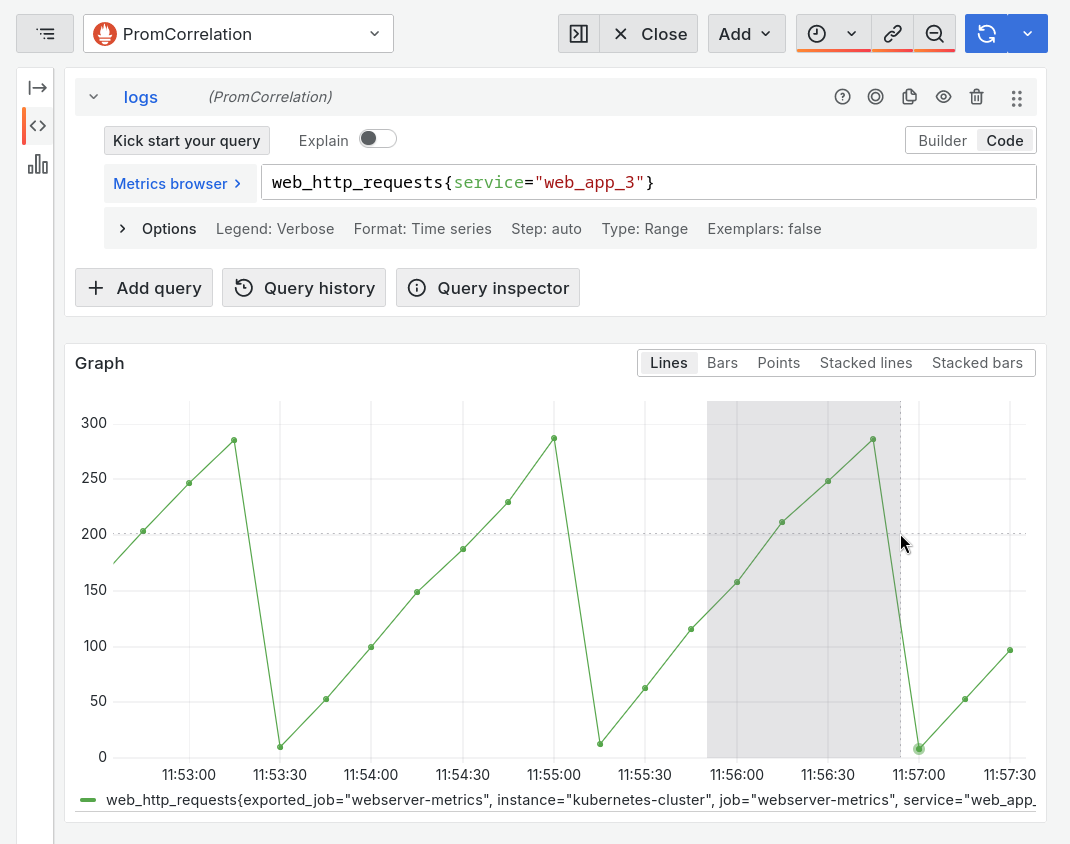
Filter down on the suspect service,
web_app_3, by modifying the query to add a label filter:web_http_requests{service="web_app_3"}Then click on Run query or press Shift+Enter to run.
Notice the suspect 'saw pattern'? Let's find out what's causing the steep drop in concurrent users requests.
Correlating Prometheus metrics with Loki logs
-
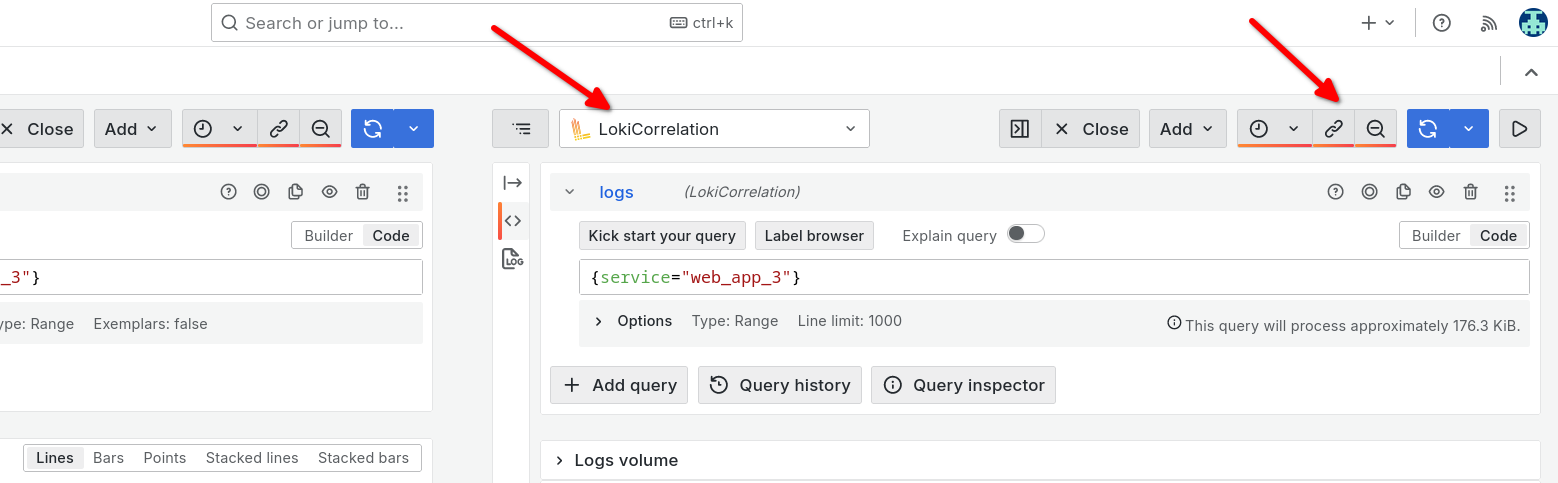
Click the split button next to the time picker.
-
The new (right) panel shows the same Prometheus query. Change the data source selection on the right-hand panel to our LokiCorrelation data source.
Notice that Grafana recognizes the label selection of Prometheus, and applies the same labels to your Loki logs query, so you see the latest relevant logs right away.
-
Click the chain button next to the time picker to sync up the time range of both views. If it is already selected, it will be highlighted in orange.
-
In the left-hand Prometheus panel, select the timerange where the drop happened, by clicking and dragging a time period with your mouse.
Notice the Loki panel time range is synced, and reloads logs from the newly selected time period.
-
If you see a lot of log lines, add an additional filter to show only the errors, by changing the Loki query to:
{service="web_app_3", error_level="ERROR"}You should see a log line showing "out of memory", which hints at a memory leak being the reason of the drop in concurrent users.
[ERROR] out of memory error. Dying...argh
Correlating Loki logs with traces
Besides outages, it’s also common to have latency issues for which traces allows us to find the bottleneck in complex request/response flows.
-
Zoom out the time range until you have log lines that start with a
tempo_trace_id.To zoom out, you can use this button:
-
Click on a log line with a Trace ID
-
In the parsed fields, next to the Trace ID value, click on the blue Tempo or View traces button:
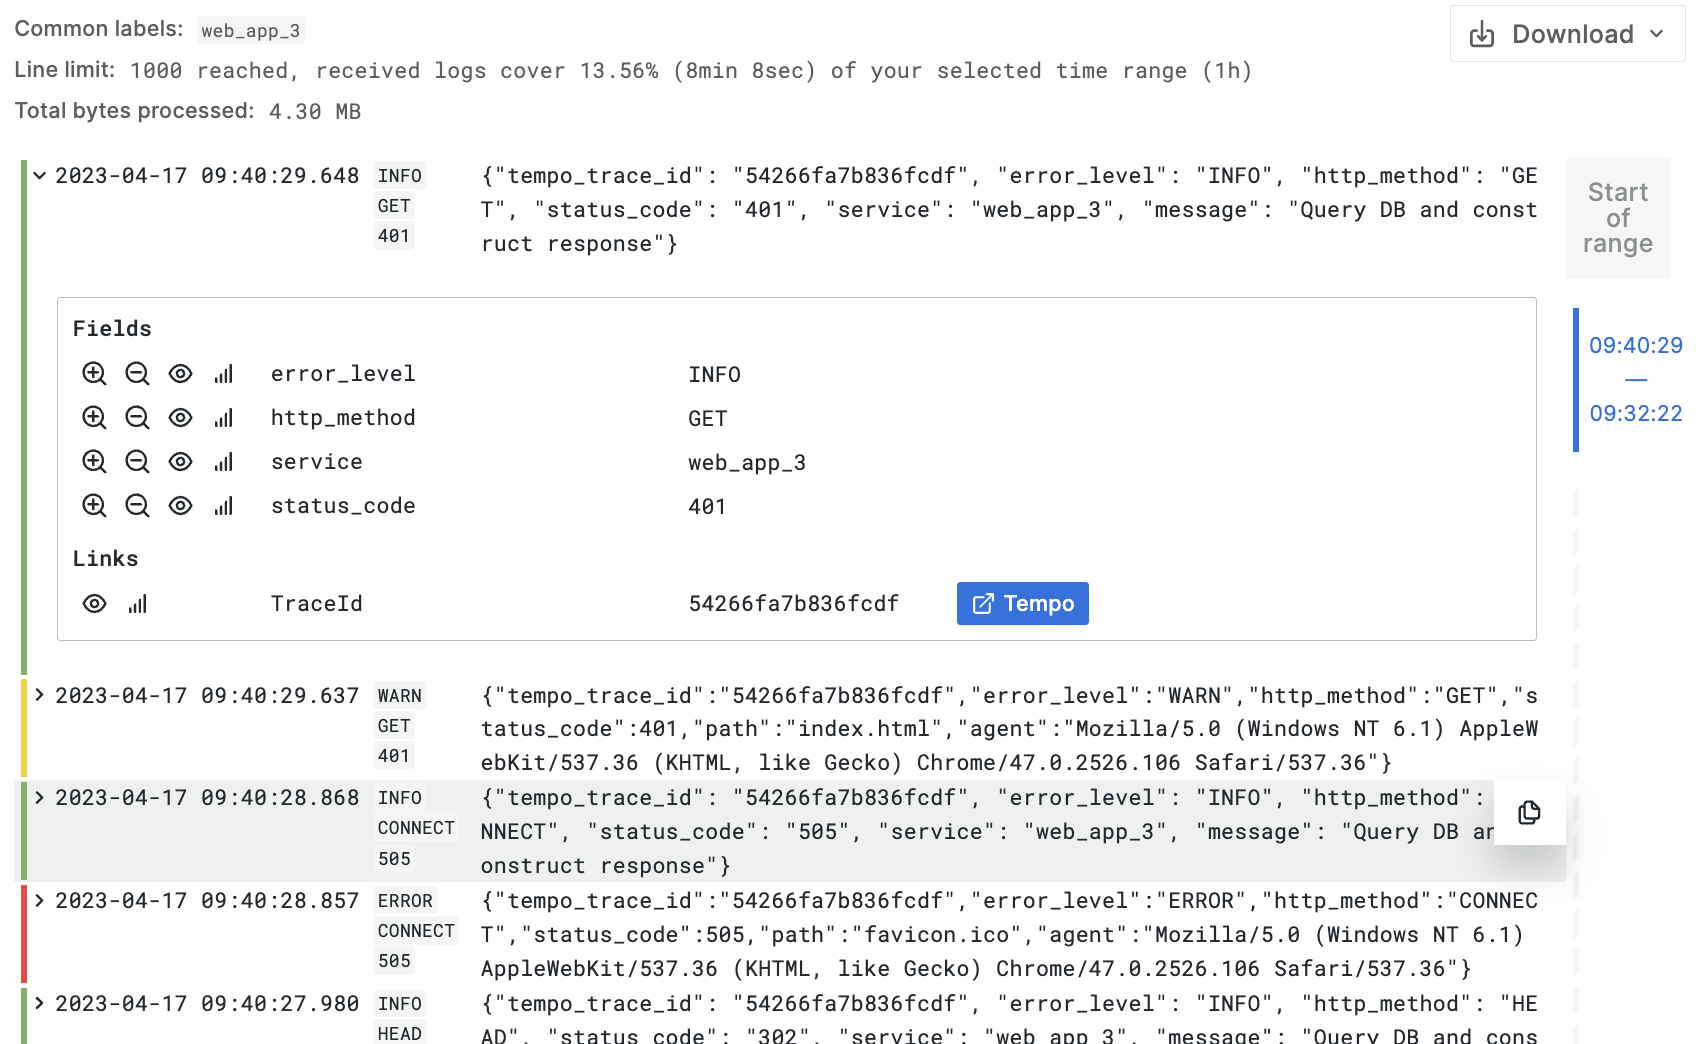
-
Grafana opens the Tempo trace view for that trace.
You can now inspect the trace in the Grafana Trace View and understand any possible bottlenecks in the request/response flow of your service.
Wrapping up
Congratulations, you've finished this first lab!
In the next lab, we'll begin to create our own custom metric queries and then bring our work together onto a dashboard.