2.1. Explore OpenTelemetry in Grafana Cloud
Now let's begin to explore your OpenTelemetry signals in Grafana Cloud.
Remember from the last lab module, your architecture now looks like this:
Now that your application is sending OpenTelemetry signals to Grafana Cloud via Alloy, you can start to see the signals inside your Grafana instance.
Step 1: Explore Application Observability
Grafana Cloud Application Observability is an out-of-the box solution to monitor applications and minimize MTTR (mean time to resolution). Application Observability natively supports both OpenTelemetry and Prometheus and allows you to bring together application telemetry with data from the frontend and infrastructure layers in Grafana Cloud.
Application Observability gives you an opinionated view of the OpenTelemetry-instrumented applications in your environment.
-
Go to your Grafana instance.
-
In the side menu, click on Application to open Application Observability.
tipIf you prefer to use the keyboard, you can press Ctrl+K (or Cmd+K on a Mac) to open the search bar, and type "Application", then hit Enter.
Application Observability opens with the service inventory. This view shows all of the services currently sending OpenTelemetry traces, or trace-based metrics, to Grafana Cloud.
-
In the Environment dropdown, clear any existing entries (using the X button) and choose lab from the list.
This will show the list of OpenTelemetry instrumented services which are reporting to be running in the
labenvironment. -
Press + Filter to add a filter. Choose service.namespace for the attribute name, and in the "value" dropdown, choose your namespace from the list.
tipIf you don't see your namespace in the service inventory, wait a few minutes. Applications appear in the service inventory once span metric generation has begun.
A quick word on semantic conventionsOpenTelemetry is at its most powerful when you follow its conventions.
We're using the power of OpenTelemetry's semantic conventions here, which is a list of well-known and standardized attributes that can be applied to your telemetry signals. Attributes allow us to slice and dice our telemetry, so that we can view metrics, logs and traces from only the specific service instances that we're interested in.
The attribute
service.namespaceis part of OpenTelemetry's semantic conventions. We can use it to store a namespace or grouping for our service. So it makes a pretty good choice for a filter here, to identify your applications from those of your fellow lab attendees.We've also used the attribute
deployment.environment, which is used by Grafana Cloud Application Observability to populate its Environment drop-down list.You'll become more familiar with OpenTelemetry resource attributes as you use them.
-
Now the service inventory will show just your rolldice service. Notice how we can instantly see high-level metrics about the service:
- Duration (P95)
- Error Rate
- Request Rate
Notice how Application Observability also shows the Java coffee-cup logo. This is because the OpenTelemetry instrumentation stores the runtime information in the attribute
telemetry.sdk.language. -
Click on the
rolldiceservice to open the Service View.Notice how the Service View title is
<namespace name>/<service name>to show you exactly which namespace we're looking at.Application Observability instantly shows us the top line stats that we would typically want to know about our service:
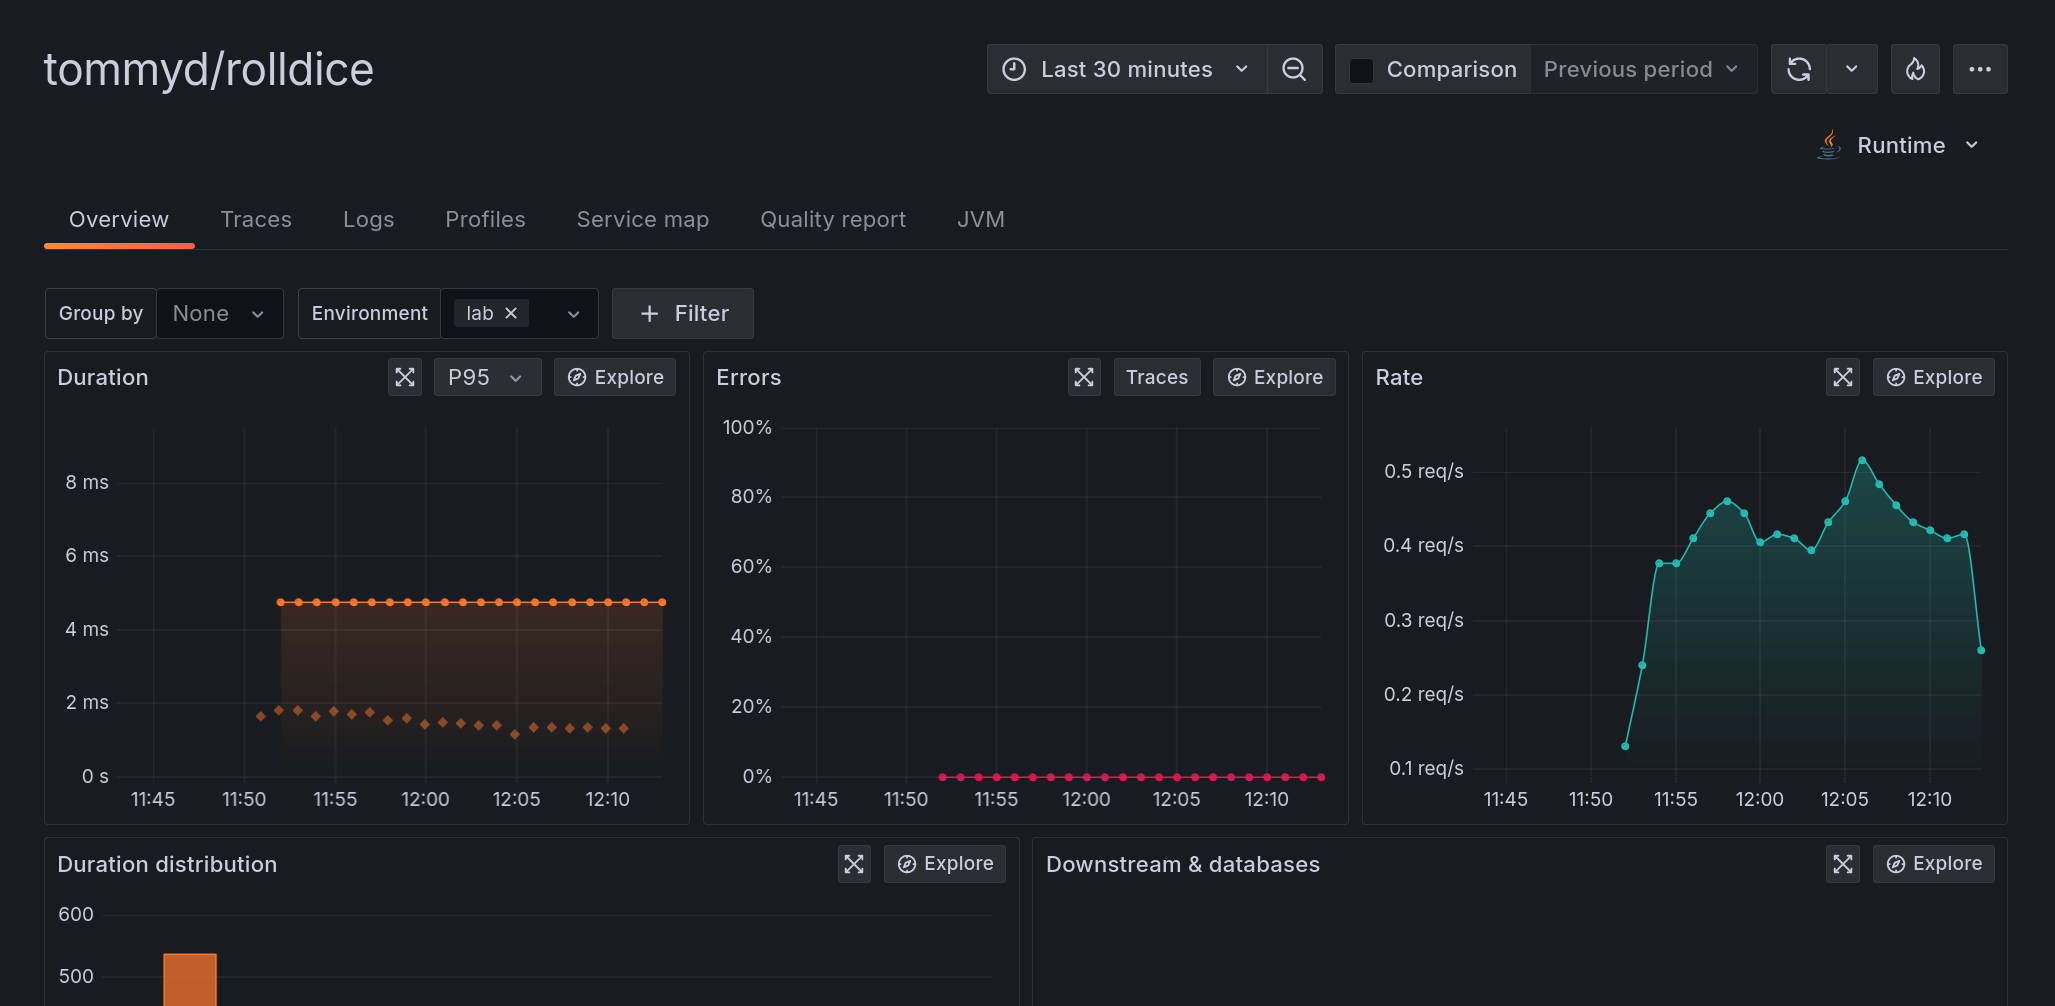
In this view you can see the most important health metrics from your application.
-
Duration of requests - mean, 95th and 99th percentiles.
-
Error rate
-
Request rate
Using Application Observability with metrics from other sourcesFor most of the visualizations in the application, Application Observability shows metrics generated from traces (so-called span metrics). By default, Application Observability generates these metrics for you.
If you prefer, you can use OpenTelemetry's Span Metrics Connector instead, to generate the metrics locally, and send them to Grafana Cloud.
For more information, see the Application Observability docs.
-
-
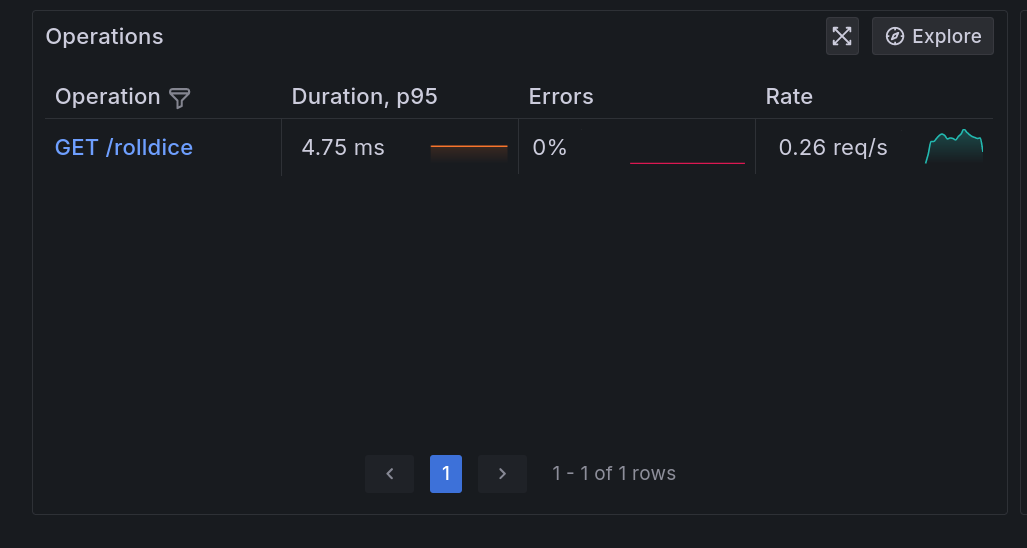
Scroll down the page, and you will find the list of operations that are being invoked on this service, along with their typical (P95) duration, error and request rates:
Step 2: Explore Traces, Logs and Metrics
Traces are one of the building blocks of OpenTelemetry. Traces allow us to observe our system from the inside out.
OpenTelemetry's instrumentation libraries generate traces from our application, which we can explore in Application Observability.
Traces
-
From the rolldice service overview, click on the Traces tab.
-
In the traces list, click on a Trace ID to open the trace view, side-by-side.
tipTo make more room for the trace tail, you can resize the view by clicking on the vertical separator bar in the middle and dragging it to the left.
-
In the trace view on the right hand side of the screen, under the heading "Service & Operation", click on the rolldice span, then expand:
-
Span Attributes
-
Resource Attributes
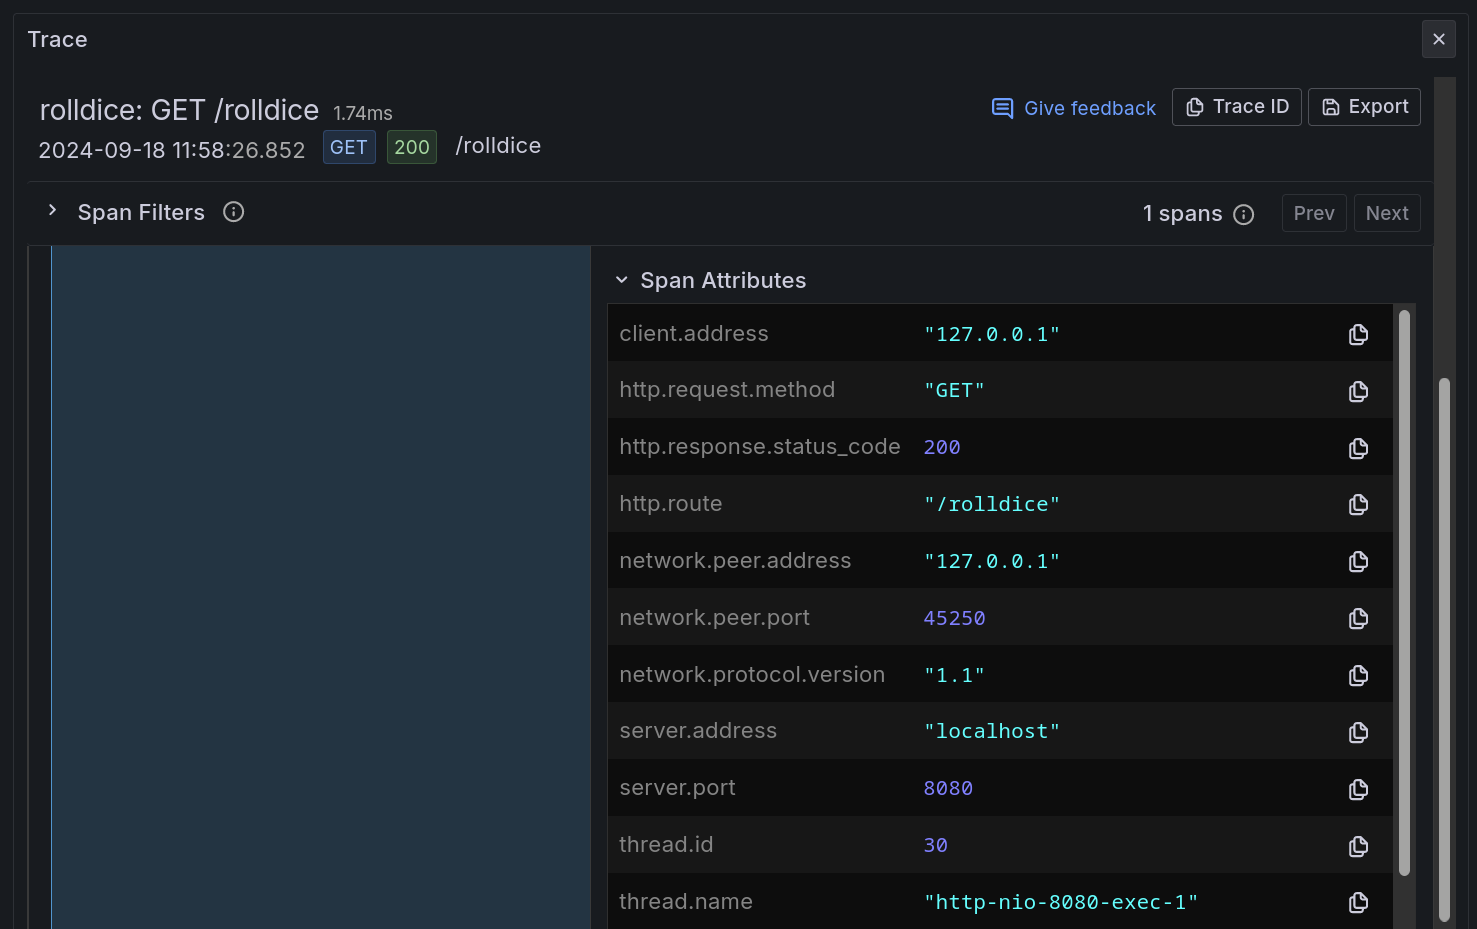
Here we can see the rich set of attributes which have been automatically captured by the OpenTelemetry agent.
 Understanding span and resource attributes
Attributes are pieces of metadata that are attached to signals:
-
Span Attributes apply to Trace Spans, and contain metadata relating to this part of the trace. In this example, we only have one span, which captures the HTTP interaction of our app. We can see attributes like
http.routeandurl.querywhich help observe the detail of this specific request. -
Resource Attributes contain metadata about our service, and the environment where it is running. We can discover attributes like
telemetry.sdk.language(Java),host.name, and so on.
-
-
Attributes are a powerful part of OpenTelemetry and make it easier to answer questions about our services.
By looking at the span attributes, can you answer the following questions?
-
The rolldice service accepts a player name in the URL's query string. A query string is the part of a URL after the question-mark, like this:
/myservice?param=value.From the span attributes, can you find the player name?
See the answer
Look at the span attribute
url.query. It should show a value likeplayer=John. -
What is the architecture of the node where the service is running?
See the answer
Look at the resource attribute
host.arch.It should show
amd64, which shows that this service is running on a 64-bit, x86 host. -
Which browser (User-Agent) made the request to the service?
See the answer
Look at the span attribute
user_agent.original.It should contain something like
k6/0.53.0 (https://k6.io/), which is because k6 is generating test requests to our service!
-
Logs
-
Click on the Logs tab.
-
On the right-hand side, ensure the New Format button is selected.
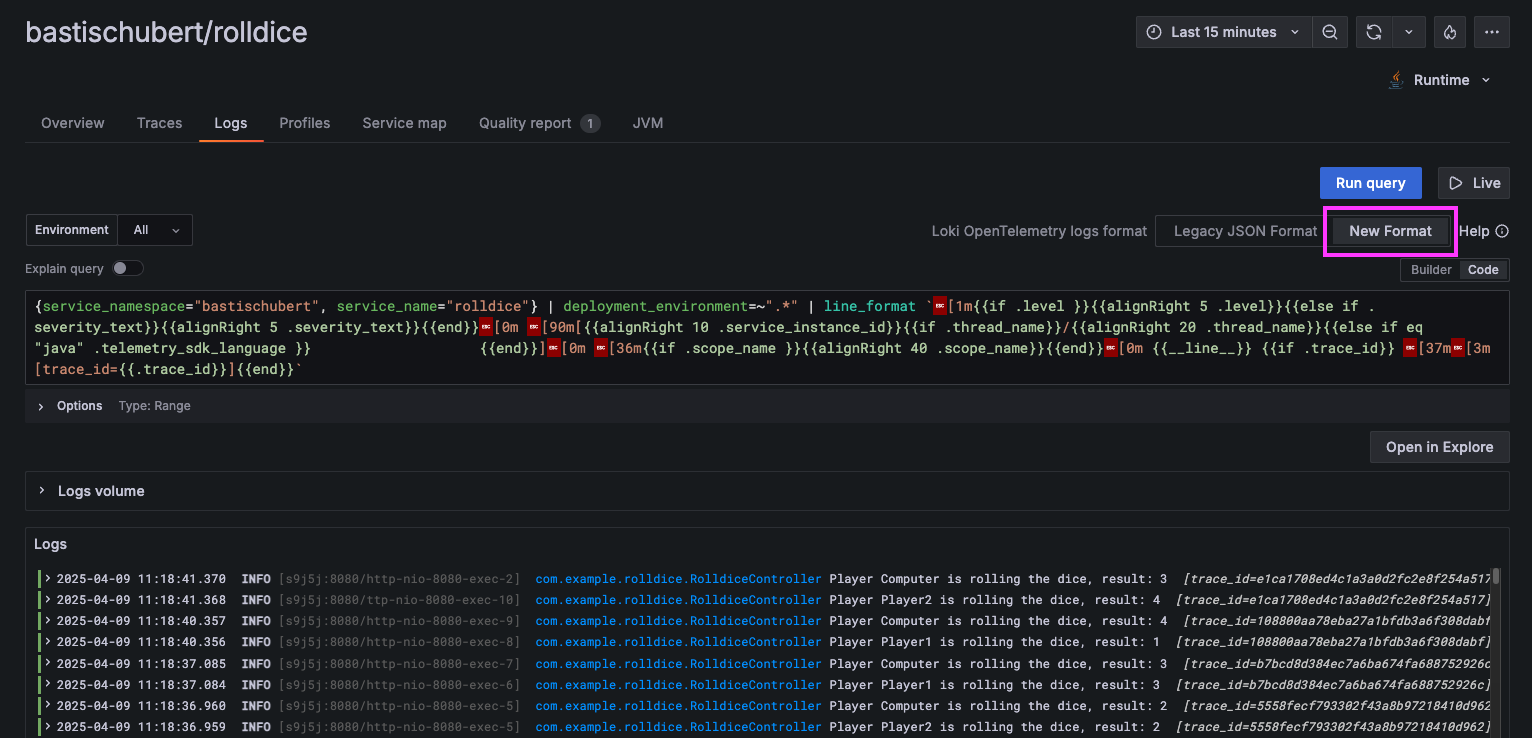
Application Observability writes and executes a Loki LogQL query, to find logs for this service, narrowed down to our namespace.
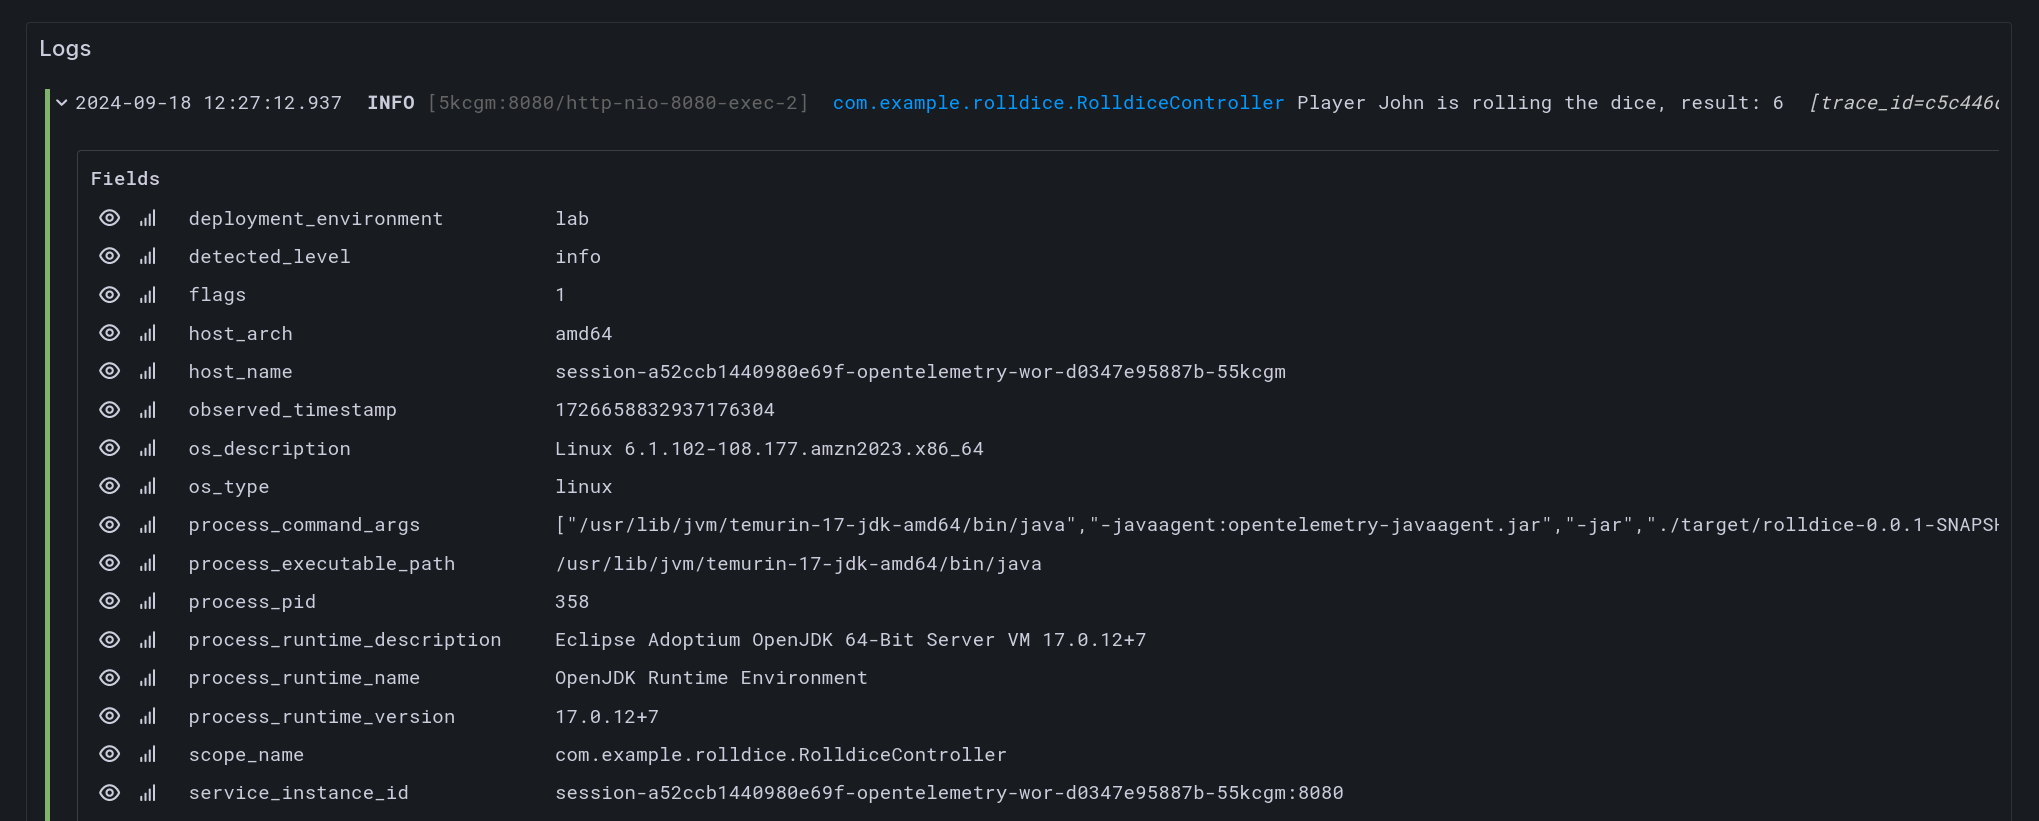
Application Observability also automatically parses and formats additional context which was sent by the OpenTelemetry instrumentation, such as the scope name (which, in Java, holds the name of the class), the log level and the trace ID.
How does Grafana Cloud process your OpenTelemetry logs?
Grafana Cloud performs some mapping on your OpenTelemetry logs:
- It determines a
service_name, and uses it as a Loki label. - It stores some other OpenTelemetry attributes as labels, like:
- deployment.environment (becomes
deployment_environment) - service.instance.id (becomes
service_instance_id)
- deployment.environment (becomes
- It stores additional OpenTelemetry attributes as Structured Metadata, which are key-value pairs that are attached to log lines.
For more information, see the Loki documentation.
- It determines a
-
Expand an individual log line by clicking on it.
Grafana Cloud captures the rich value of OpenTelemetry resource attributes such as
host.name, anddeployment.environment, by attaching them to each log line, replacing periods with underscores.This provides invaluable context when troubleshooting a problem:
-
We can also correlate from logs immediately to traces.
Scroll down a little further, then, next to traceID, click on the View trace button.

Then, you will be taken to the Traces tab to view that specific trace, where you can view more information about this request.
Runtime metrics and information
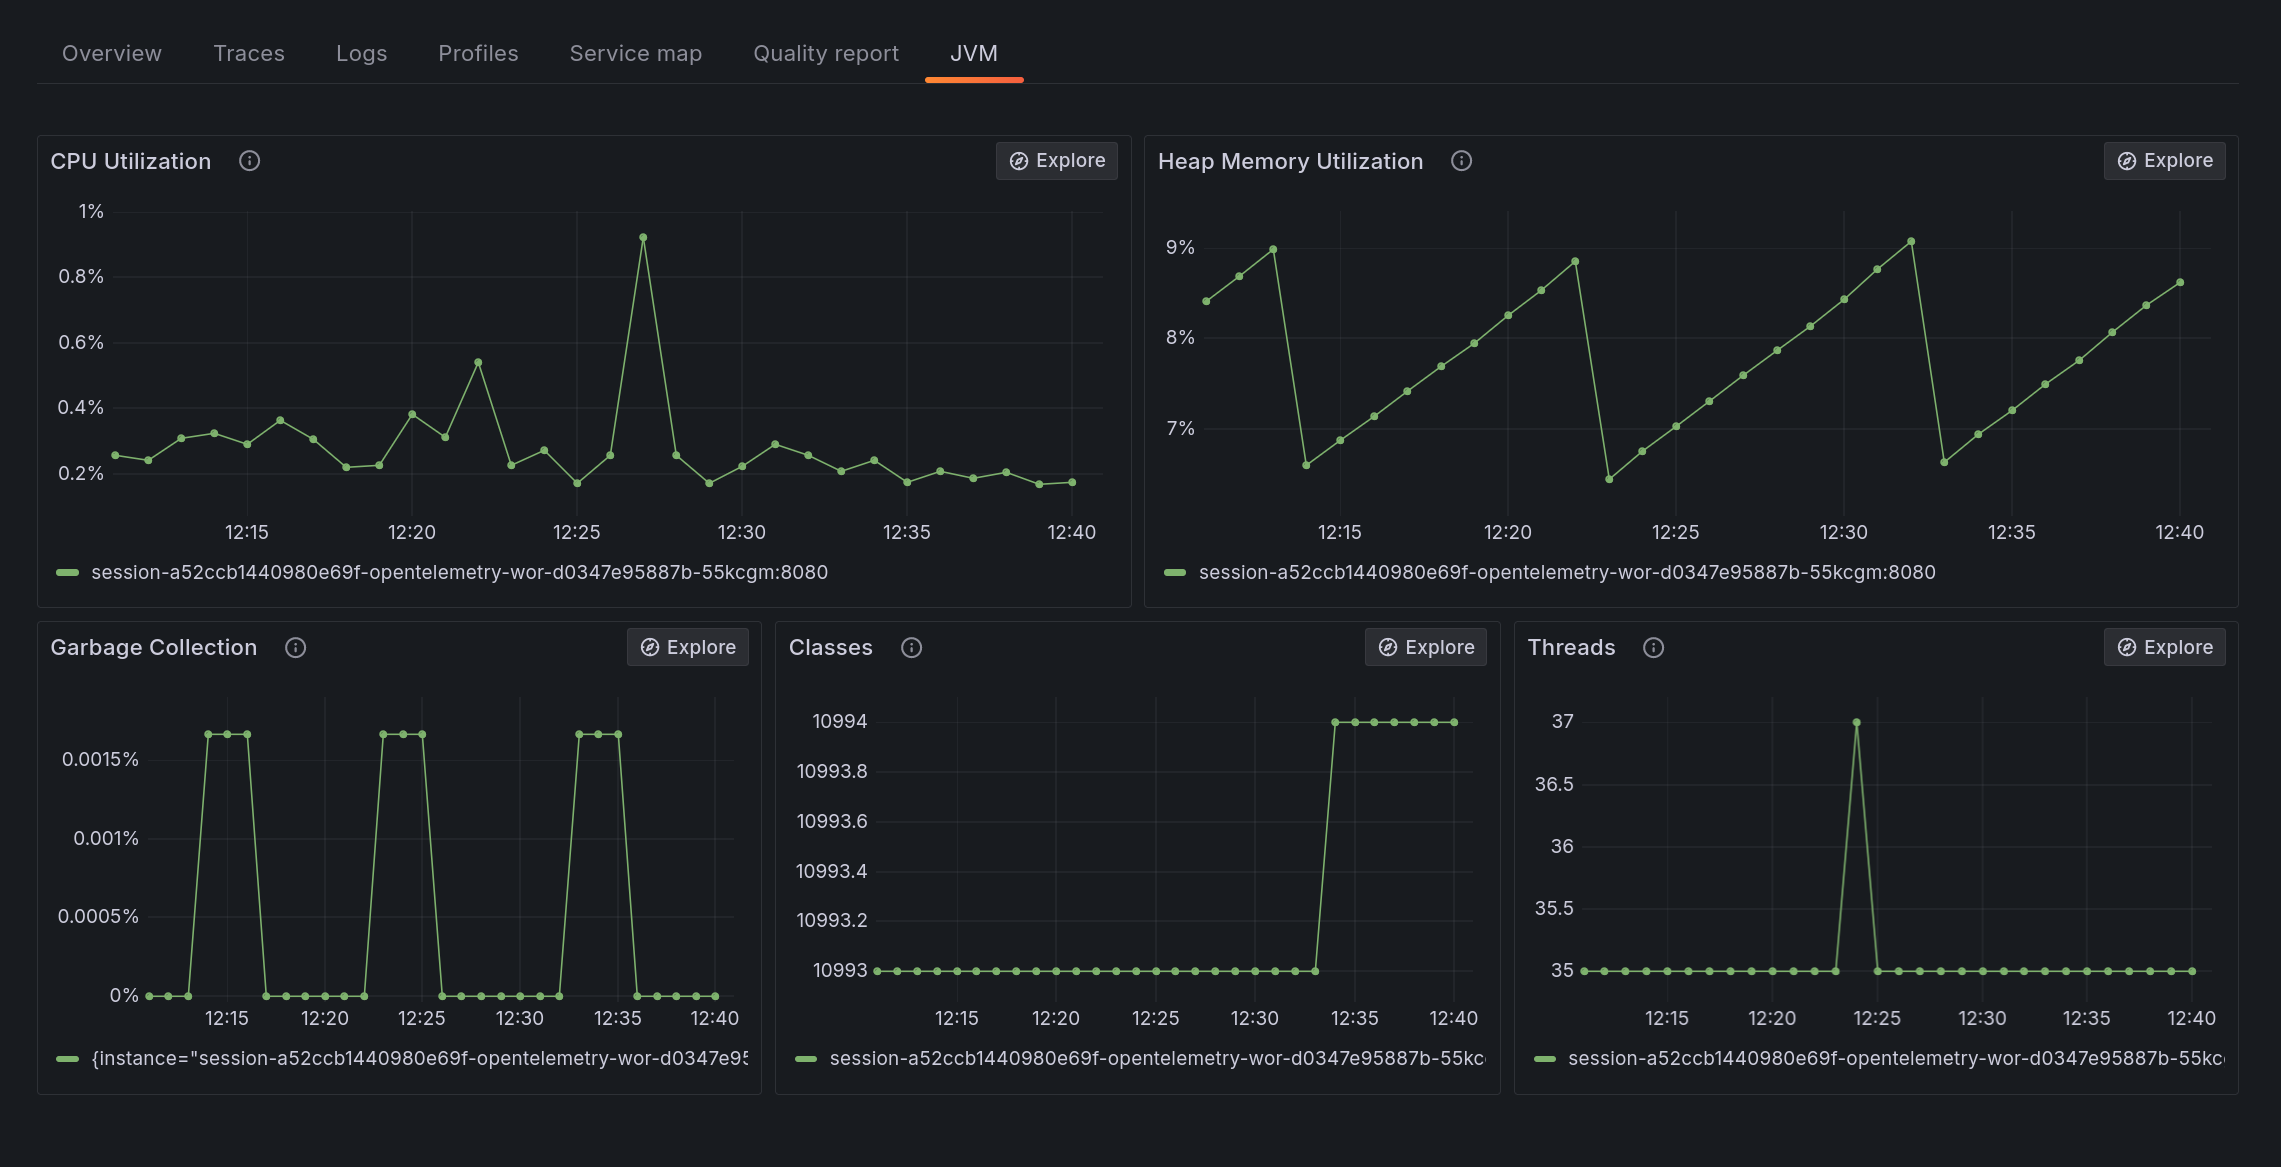
In addition to traces and logs, OpenTelemetry auto-instrumentation also captures some helpful runtime metrics for our applications, right out of the box.
These metrics can be really helpful for monitoring trends, or identifying issues which may not immediately be obvious from traces or logs.
-
From Application Observability for the rolldice service, click on the JVM tab.
This tab in Application Observability changes dynamically, depending on the language of the instrumented service. In this case, it shows some metrics which are typical for a Java application:
-
CPU Utilization
-
Heap memory utilization
and more.
-
-
Finally, at the top right of the screen, click on the Runtime dropdown near the service name.
You'll see information about the runtime (Java) which has been captured by OpenTelemetry: namely the language.
Wrapping up
In this lab, you've learned how to do the following:
-
Explore OpenTelemetry-instrumented Services in Application Observability
-
Use resource attributes to narrow down and view signals for a specific service
-
View and correlate between traces and logs
-
View runtime metrics from an application
Click on the next module to continue.