2.2. Add a second service
In this lab, you'll add a second service to the architecture, with OpenTelemetry instrumentation.
After you complete this module, your environment will look like this:
Step 1: Run a Go program with OpenTelemetry instrumentation
Some languages require you to add OpenTelemetry libraries or code into your application. Go is one example of a language that uses this approach.
In this part of the workshop, we will run a Go program which is instrumented with OpenTelemetry libraries. To save time, we've already added the instrumentation code for you.
This service is called gameserver. It runs a simple game, where a user competes with the Computer to get the highest score. The gameserver service calls the rolldice service (from Lab 1) to obtain two random rolls of the dice. The winner of each game is the player with the highest score.
(Keen observers may spot there's something missing in these requirements. You'll find out what it is, shortly!)
Let's run the gameserver:
-
Open your virtual development environment.
-
Firstly, stop the rolldice k6 test if it is still running: find the terminal running the k6 script, and press Ctrl+C to abort the test, then close the terminal.
-
Open a new terminal (Terminal -> New Terminal), and type the following to copy the second project into your persistent workspace, then enter the new directory:
cp -r /opt/gameserver /home/project/persisted/

cd /home/project/persisted/gameserver -
In the project Explorer tree, find the file
persisted/gameserver/otel.goand open it, to inspect the code.tipIf you plan to instrument your own Go application, you can follow a step-by-step guide in the Grafana Cloud documentation.
Inside
otel.gois some boilerplate code to initialize the OpenTelemetry SDK and add auto-instrumentation of packages. It sets up traces, logs and metrics exporters.Like the other OpenTelemetry language SDKs, it can be configured with environment variables, which we will do next.
-
Let's set our OpenTelemetry resource attributes for this application.
Open the run script,
persisted/gameserver/run.sh. Just before the final line (go run .), insert these lines, replacing<your chosen namespace>with the same namespace you chose in the previous lab:export NAMESPACE="<your chosen namespace>"
export OTEL_RESOURCE_ATTRIBUTES="service.name=gameserver,deployment.environment=lab,service.namespace=${NAMESPACE},service.version=1.0-demo,service.instance.id=${HOSTNAME}:8090" -
In an unused terminal, change to the
persisted/gameserverdirectory and run gameserver. It might take a minute or two to start, as your code will need to be compiled:cd /home/project/persisted/gameserver
./run.shRolldice should still be runningMake sure the rolldice application is still running before running the next command, because the gameserver app depends on it. If the rolldice service has stopped, refer back to the previous Lab to see how to run it.
-
Finally, let's generate some load to the service.
tipEnsure you have stopped the rolldice k6 load test from Lab 1 before continuing. To stop the load test, find the terminal where k6 is running, and press Ctrl+C.
In a new terminal, run the following commands:
cd /home/project/persisted/gameserver

k6 run loadtest.js
You should see some requests arriving into rolldice. k6 is sending test requests to gameserver, which is calling rolldice to get random numbers.
By the end of this step, you should be running the complete system:
-
An OpenTelemetry collector (Grafana Alloy)
-
The rolldice application (Java)
-
The gameserver application (Go)
-
The gameserver load test script (k6)
Step 2: Explore the Service Map and Overview
Now that we've instrumented a second service, we will be able to visualize the interaction between these services in a Service Map.
-
In Grafana, navigate to Application Observability (from the side menu, click Application).
-
Using the filters, narrow down the service inventory to:
-
environment = lab
-
service.namespace = (your chosen namespace)
-
-
Click on the Service Map tab.
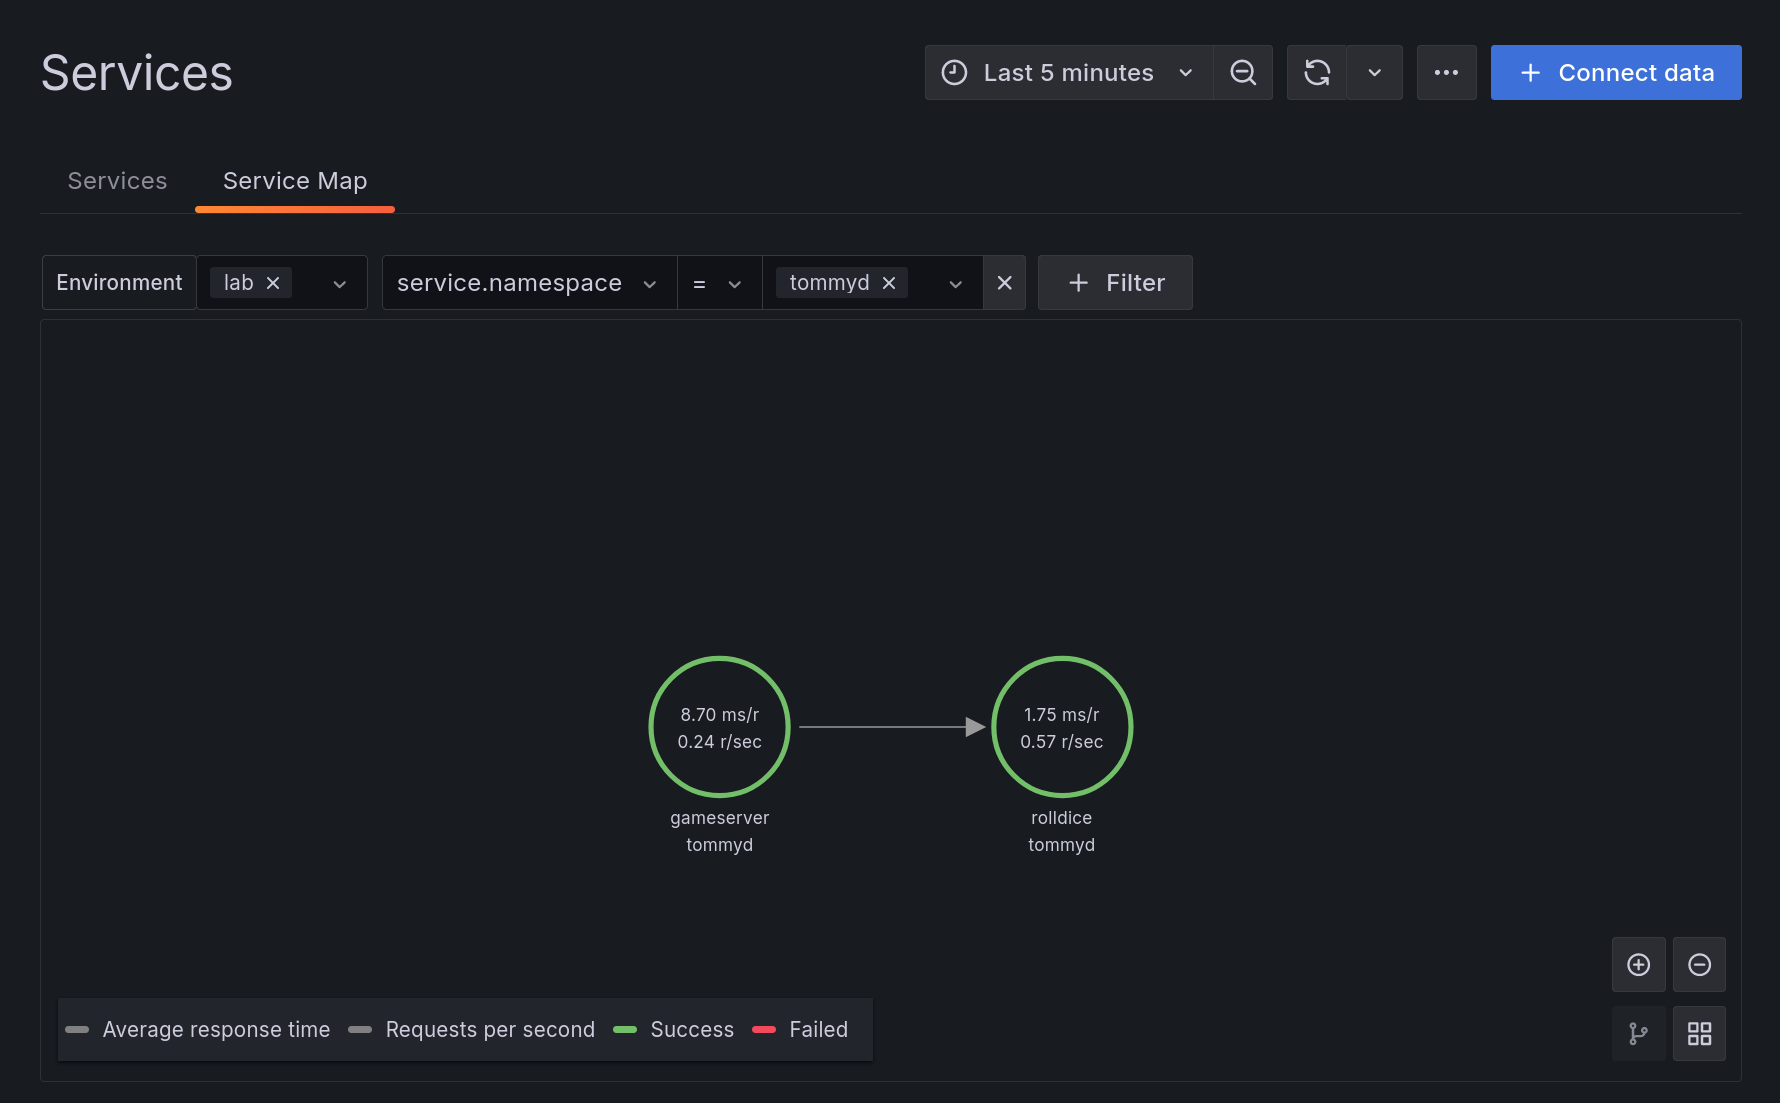
You'll now see a visualization of all services that match the given filters, and their metrics. This Service Map is generated from span metrics.
tipIf you can't see both services in the service inventory list, wait a few moments for span metrics to be generated. Then, click the Refresh button.
In the map, notice how you can see the flow of interaction between gameserver and rolldice. You can also see the number of requests per second to the service:

-
Click on the gameserver circle in the map, then click on Service Overview.
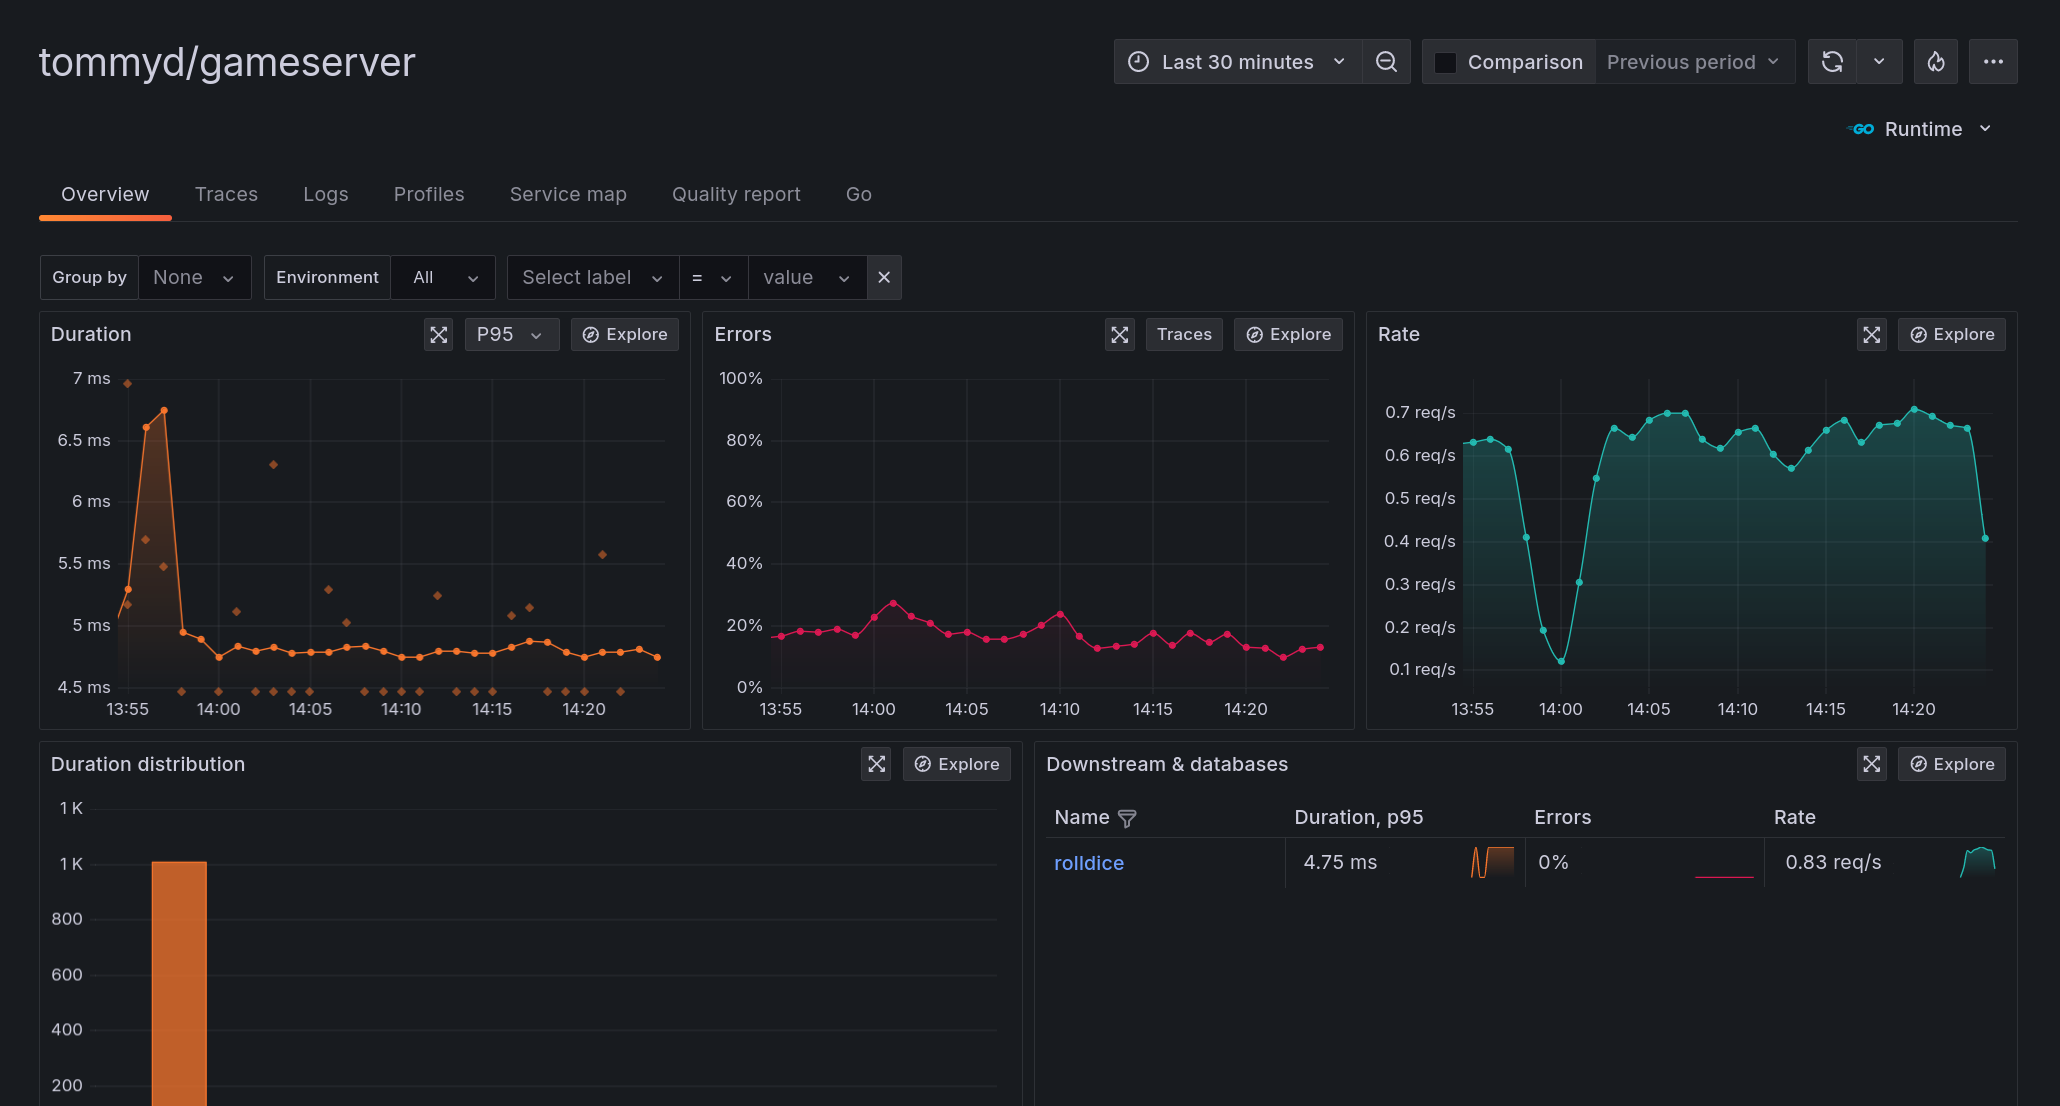
Now we can see the health of this service. In the Downstream panel, notice how Grafana has identified the downstream service (rolldice from Lab 1).

You'll notice that our service seems to be throwing some errors. We'll look at those next.
Step 3: Diagnose an error
Let's zoom in on these errors that our service seems to be experiencing.
OpenTelemetry auto-instrumentation can mark traces with a status of error when it detects that an error is being returned by the service. That makes it a lot easier to identify failed requests to our services. In Grafana Cloud, we can easily correlate to find out the root cause.
-
From the Service Overview screen for gameserver, find the Errors graph, and click on the Traces button to show errored traces.
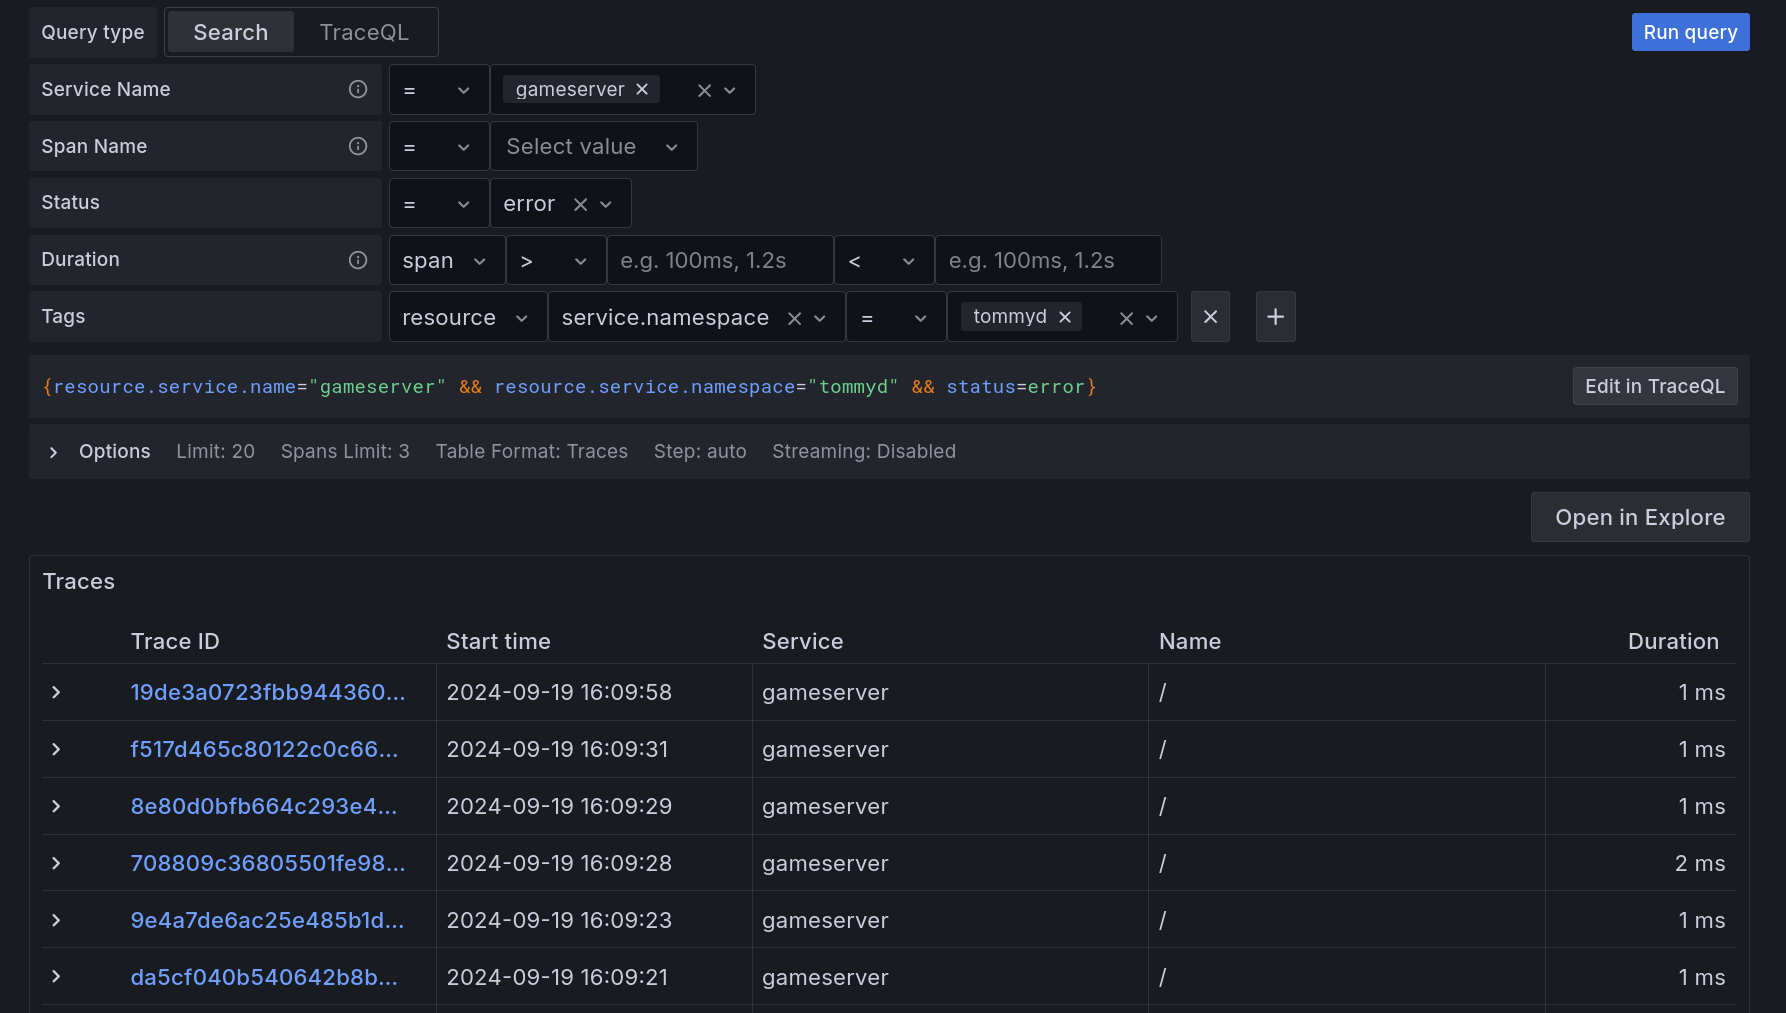
Application Observability navigates to the Traces tab and lists traces which were marked with a
statusoferror, in the selected time frame.
Notice how the Traces tab has generated the following TraceQL query, to find all errored traces:
{resource.service.name="gameserver"
    && resource.deployment.environment=~"lab"
    && resource.service.namespace="<NAMESPACE>"
    && status=error}
Did you notice the OpenTelemetry attributes within this TraceQL query? In this query, we're referencing resource attributes, by adding the
resource.prefix to the attribute names.For example:
resource.service.namespace, andresource.service.name. -
Find a trace and click on the trace ID to open the Trace view. Now we're beginning to see some interesting traces!
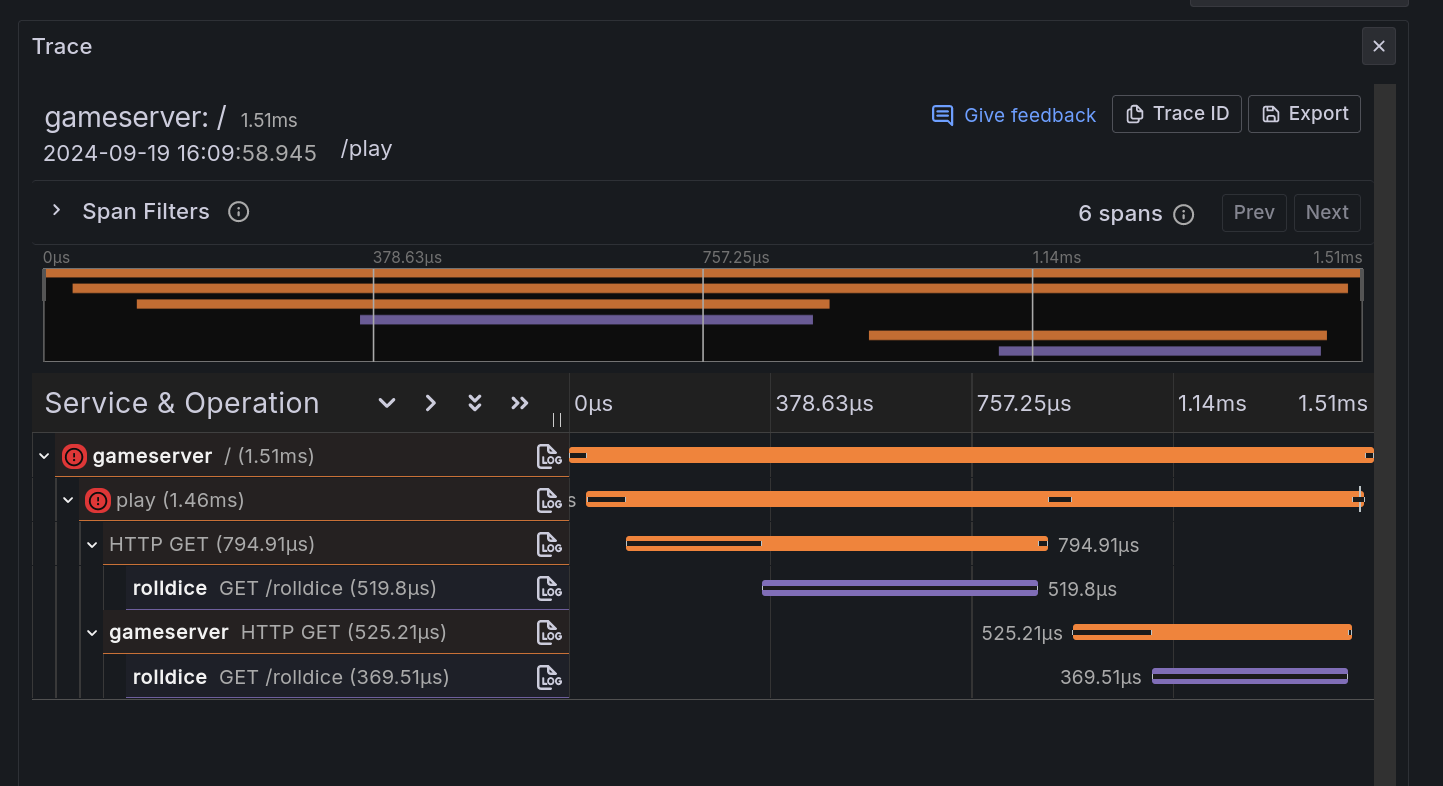
The gameserver application makes two calls to rolldice to fetch a random number, so it can calculate a result for the game.
The trace visualizes the two calls to the rolldice service in a different color:

-
We viewed this trace because it had an error. Let's find out the root cause.
Click on one of the errored span names to expand the trace. Can you find out why the service errored?
You can also click Logs for this span to view logs, if you want to see the relevant logs around this span.
Question: Why do you think this service is throwing an error? You can check your hypothesis in the quiz at the end of this lab.
-
Once you've diagnosed the error, can you use the trace information to find out the answer to this question:
-
Which OpenTelemetry instrumentation libraries (name and version) were used to create these traces?
See how to find the answer
Look at the text in the header of each span. It should have a Library Name and Library Version field. e.g.:
- go.opentelemetry.io/contrib/instrumentation/net/http/otelhttp (for Go's HTTP capabilities)
- io.opentelemetry.tomcat-10.0 (for Java's Tomcat webserver)
-
OpenTelemetry's instrumentation libraries lay the groundwork for telemetry. They do things like generating spans and metrics from the everyday libraries and frameworks that you use in your app.
Instrumentation libraries are available for many different frameworks and packages, such as Go's native http package.
Wrapping up
In this module you learned how to:
-
See what some typical OpenTelemetry SDK boilerplate code looks like
-
Visualize a Service Map of your OpenTelemetry tracing instrumented services
-
Navigate to errored traces, and correlate to logs to find a root cause
Most importantly, we didn't need to add extra configuration to our collector. Grafana Alloy received OTLP signals from our services, and forwarded them automatically to Grafana Cloud.
Click the next module to continue.